Linear Regression Basics
This is our first real introduction into modeling. We need to examine how a model relates to data as well as criteria to compare models.
Regression can be a scary word, so let’s start by putting our minds at ease. When you collect data, you’ll often find a large degree of variance — or minor noise — between all of your records. We’ll get into the ‘why’ a bit later, but for now, just think about how as you collect samples, you will get outliers. As you keep collecting samples however, you’ll notice that the data starts to ‘bunch up’. This is a concept called ‘regression to the mean’. Essentially, as you get more and more data, the data points will pile up around the center. This makes sense intuitively: the mean is meant to describe the central tendency. Regression analysis and modeling doesn’t actually ‘use’ a regressive process, but it does operate on the assumption that a series of central measures can predict, forecast or otherwise explain causation.
Still a little dense? Don’t worry, by the end of this section, it’ll feel better.
What does regression do for us?
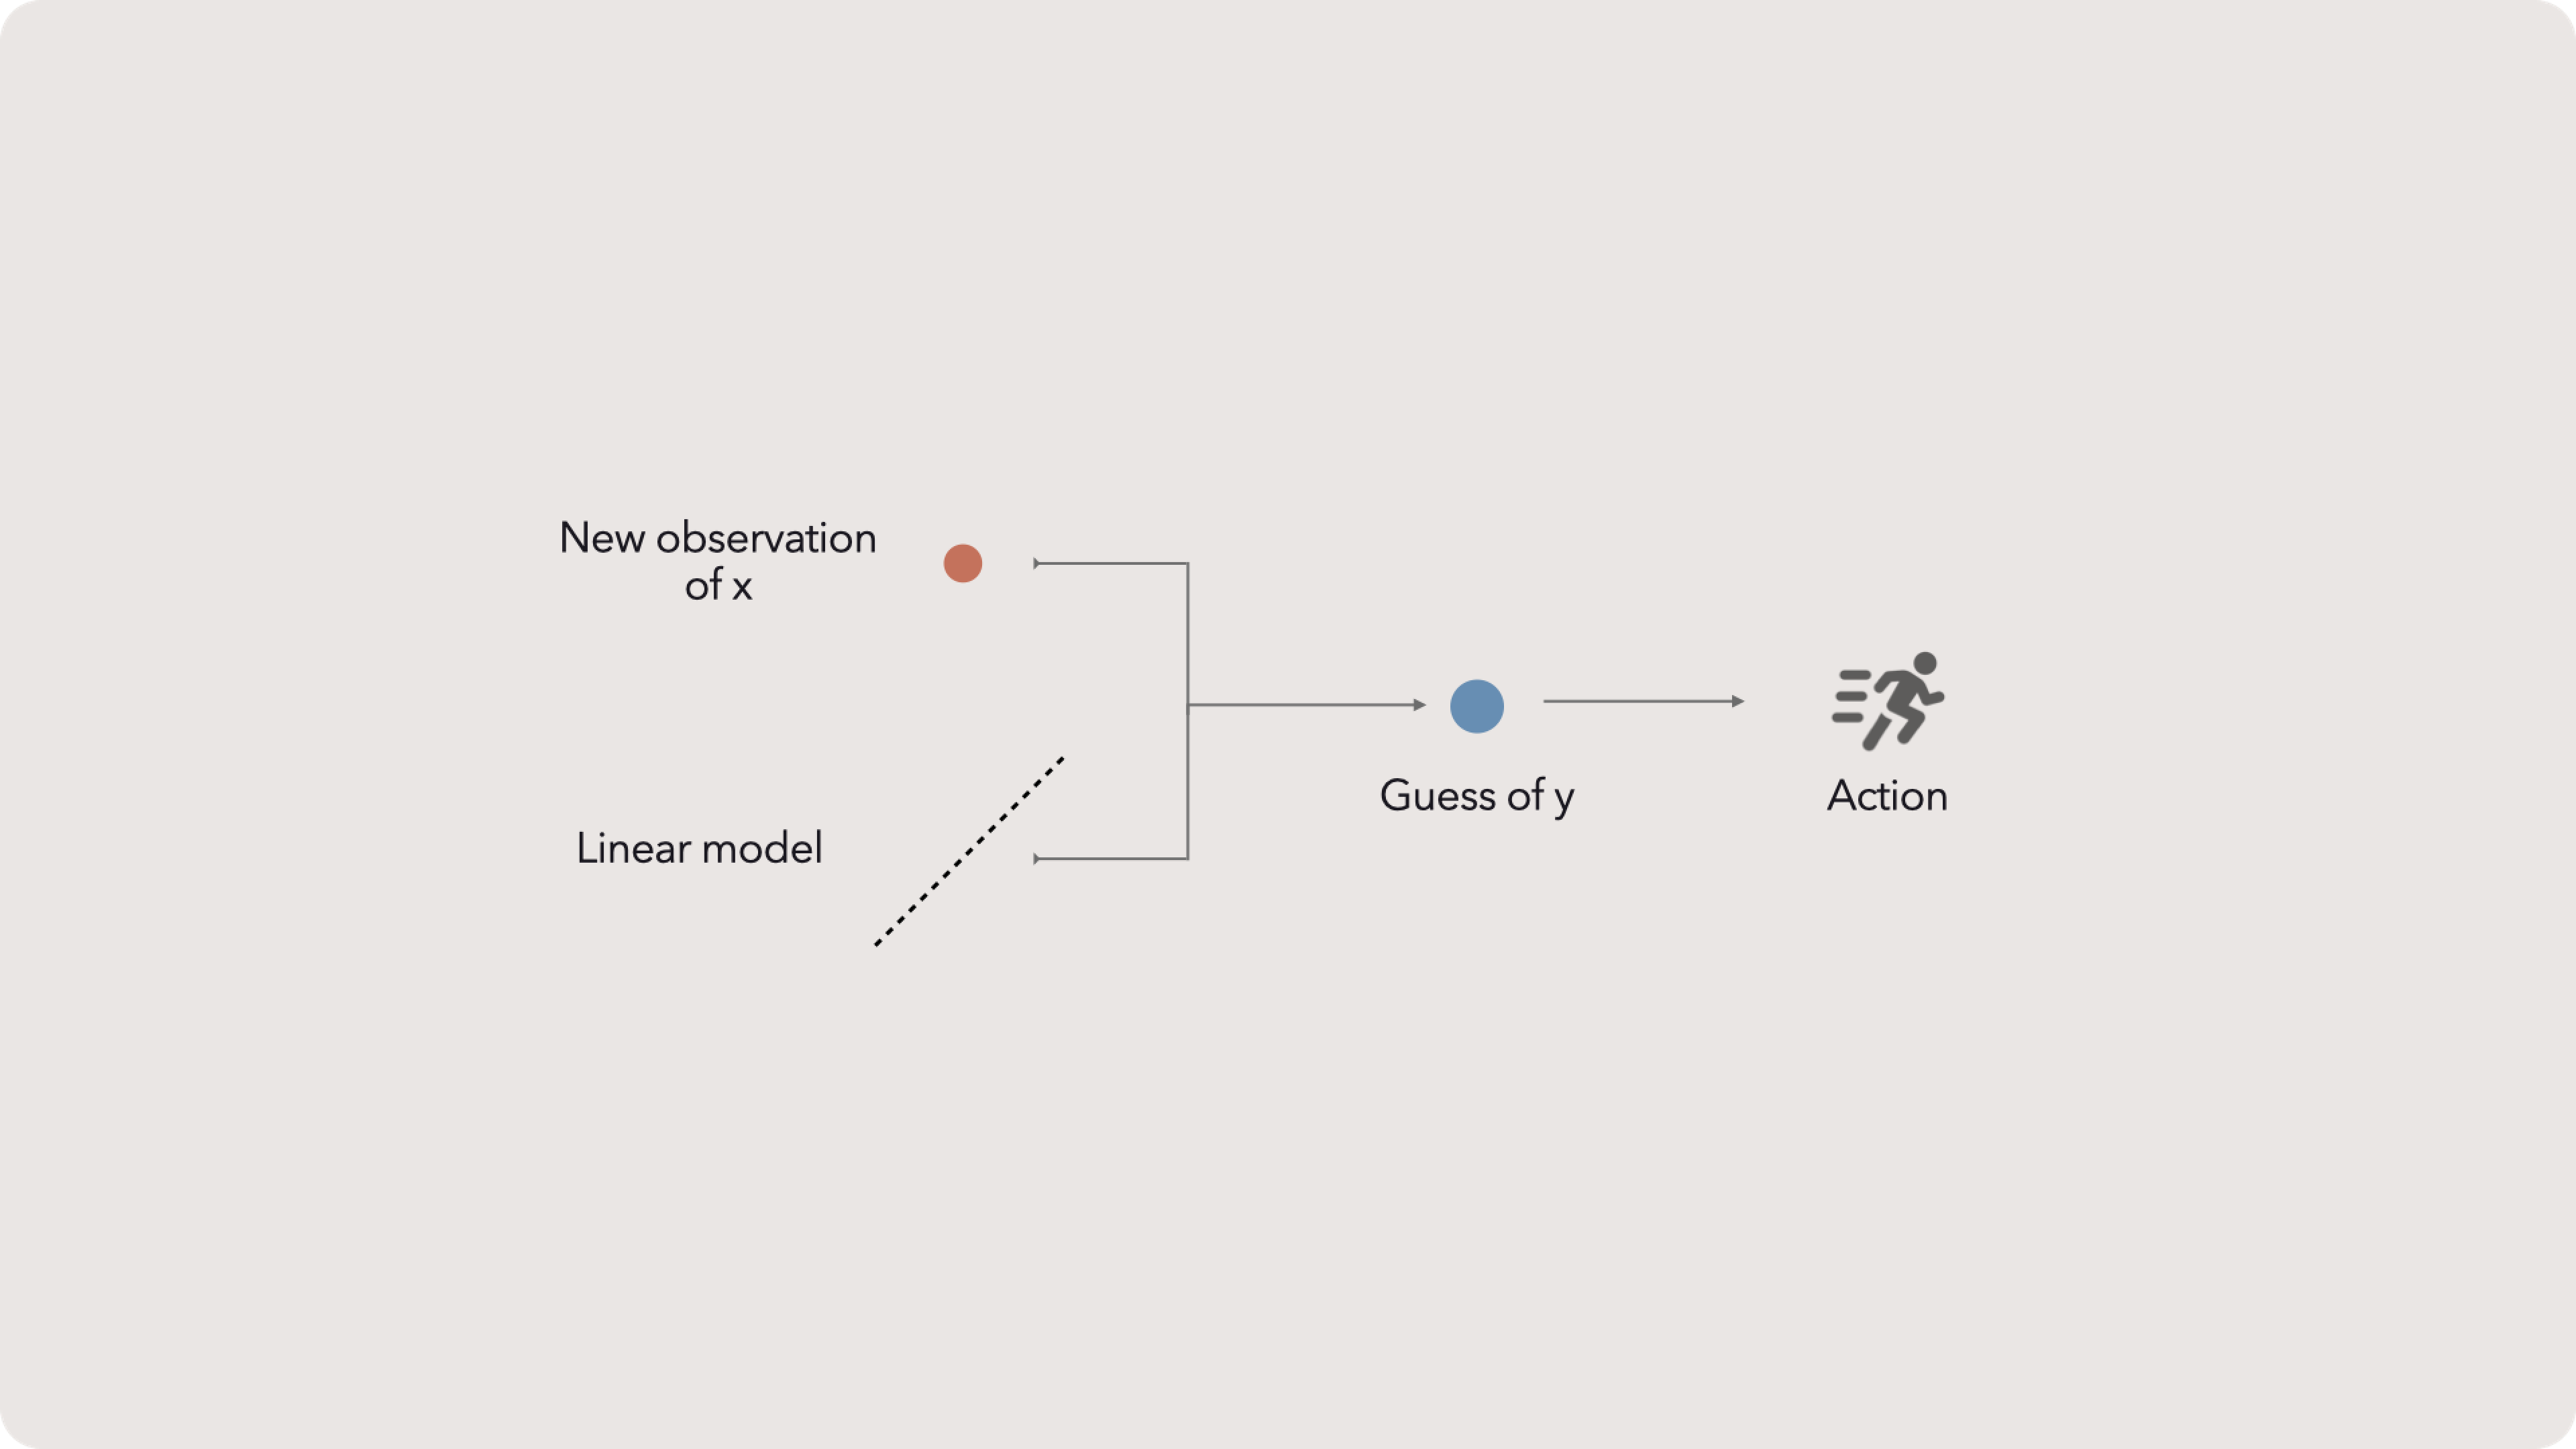
We can do this by combining a new observation of an /independent/ variable, x, with a linear model. This linear model was built with a sample data set containing x values and observed y values.
With our y-hat, we’ll have an insight. Remember if your insights are provoking action, including deeper thought, then you’re probably not measuring anything important.
A quick note: in this section I’ll use 'regression' as a short hand for a linear model — and technically, an ‘ordinary least squares’ linear model. However, there are other ways to build linear models and there are other regressions, notably logistic regression which is a great binary classifier. The techniques we’ll discuss are the biggest bang for the buck. If these don’t work for your specific case, then you’ll likely need a specialist.
Plotting data
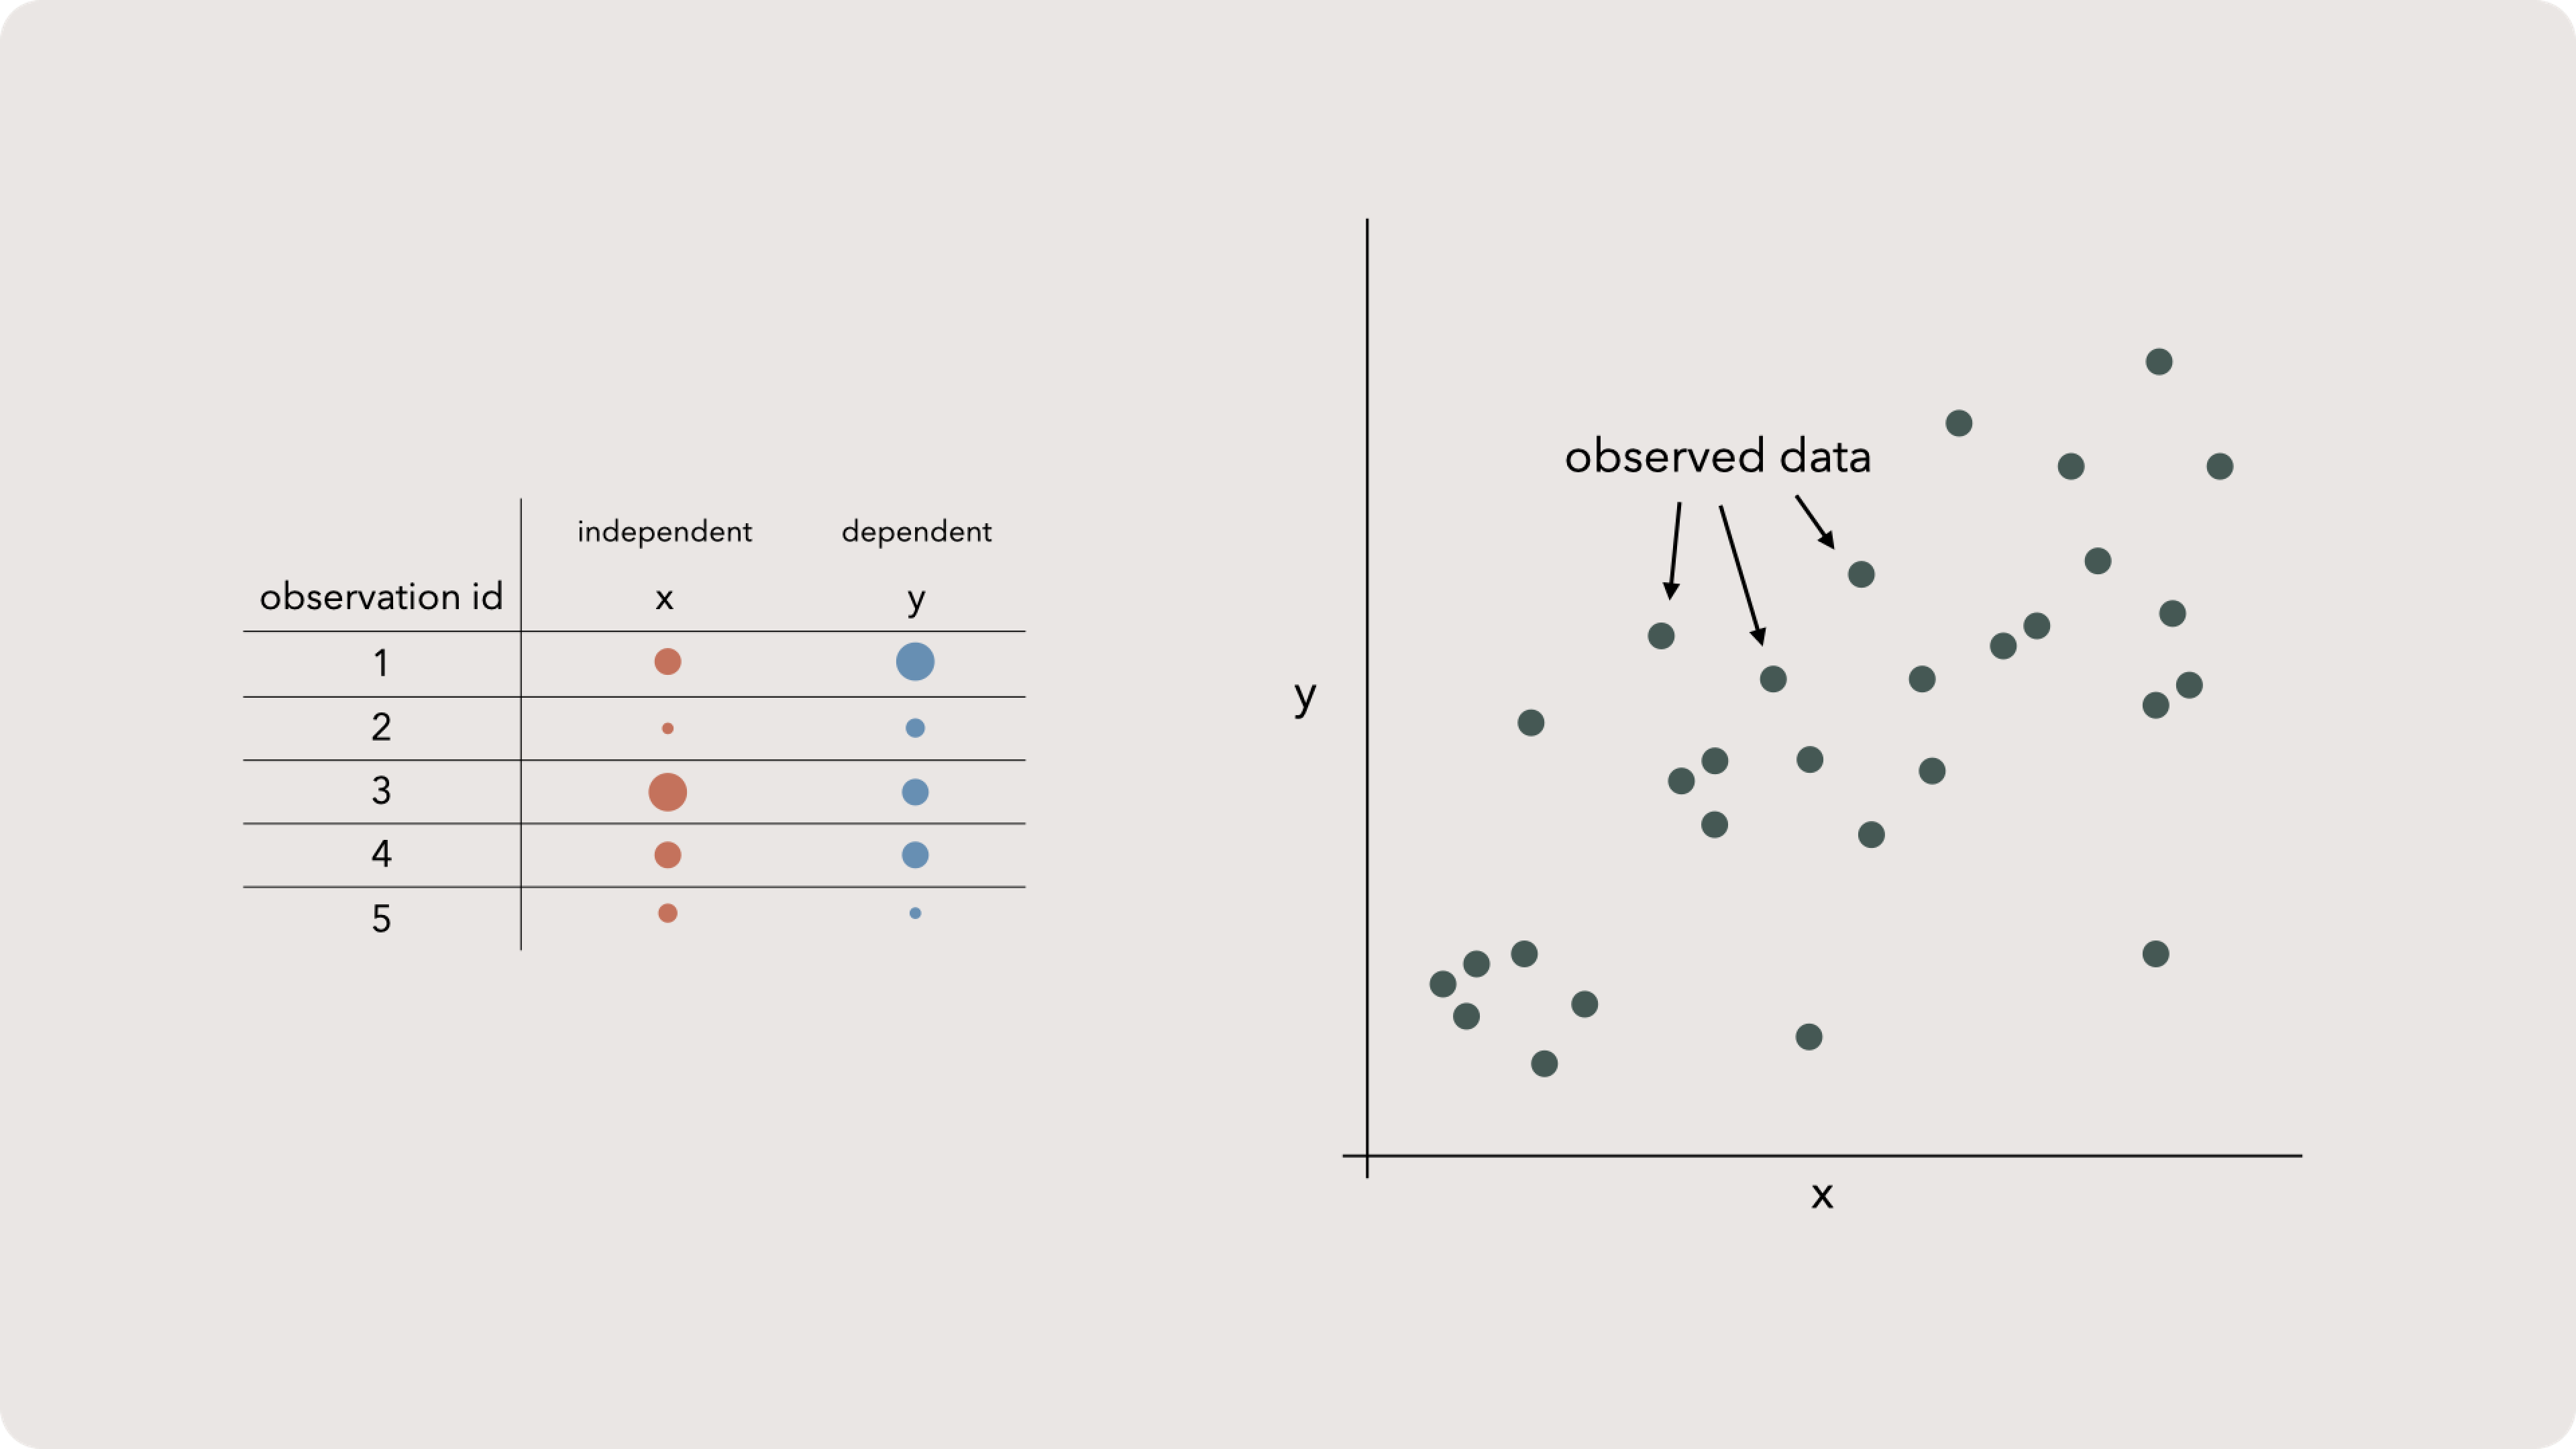
We don’t need to dive into his particulars except to brush up on a few fundamentals. If we have a data set and we want to plot it, we can draw two lines that are perpendicular. By convention, the vertical line will hold our y-variable and the horizontal one will represent x.
If we place every observation as a mark on this plane, we create a scatter plot. Nothing too exciting, but this allows us to visually see the spread and scope of our data. This is useful but ‘noisy’ — meaning imperfections in our samples obscure any deep insights. The good news is that we can draw a line through our data to simplify everything!
Defining a line
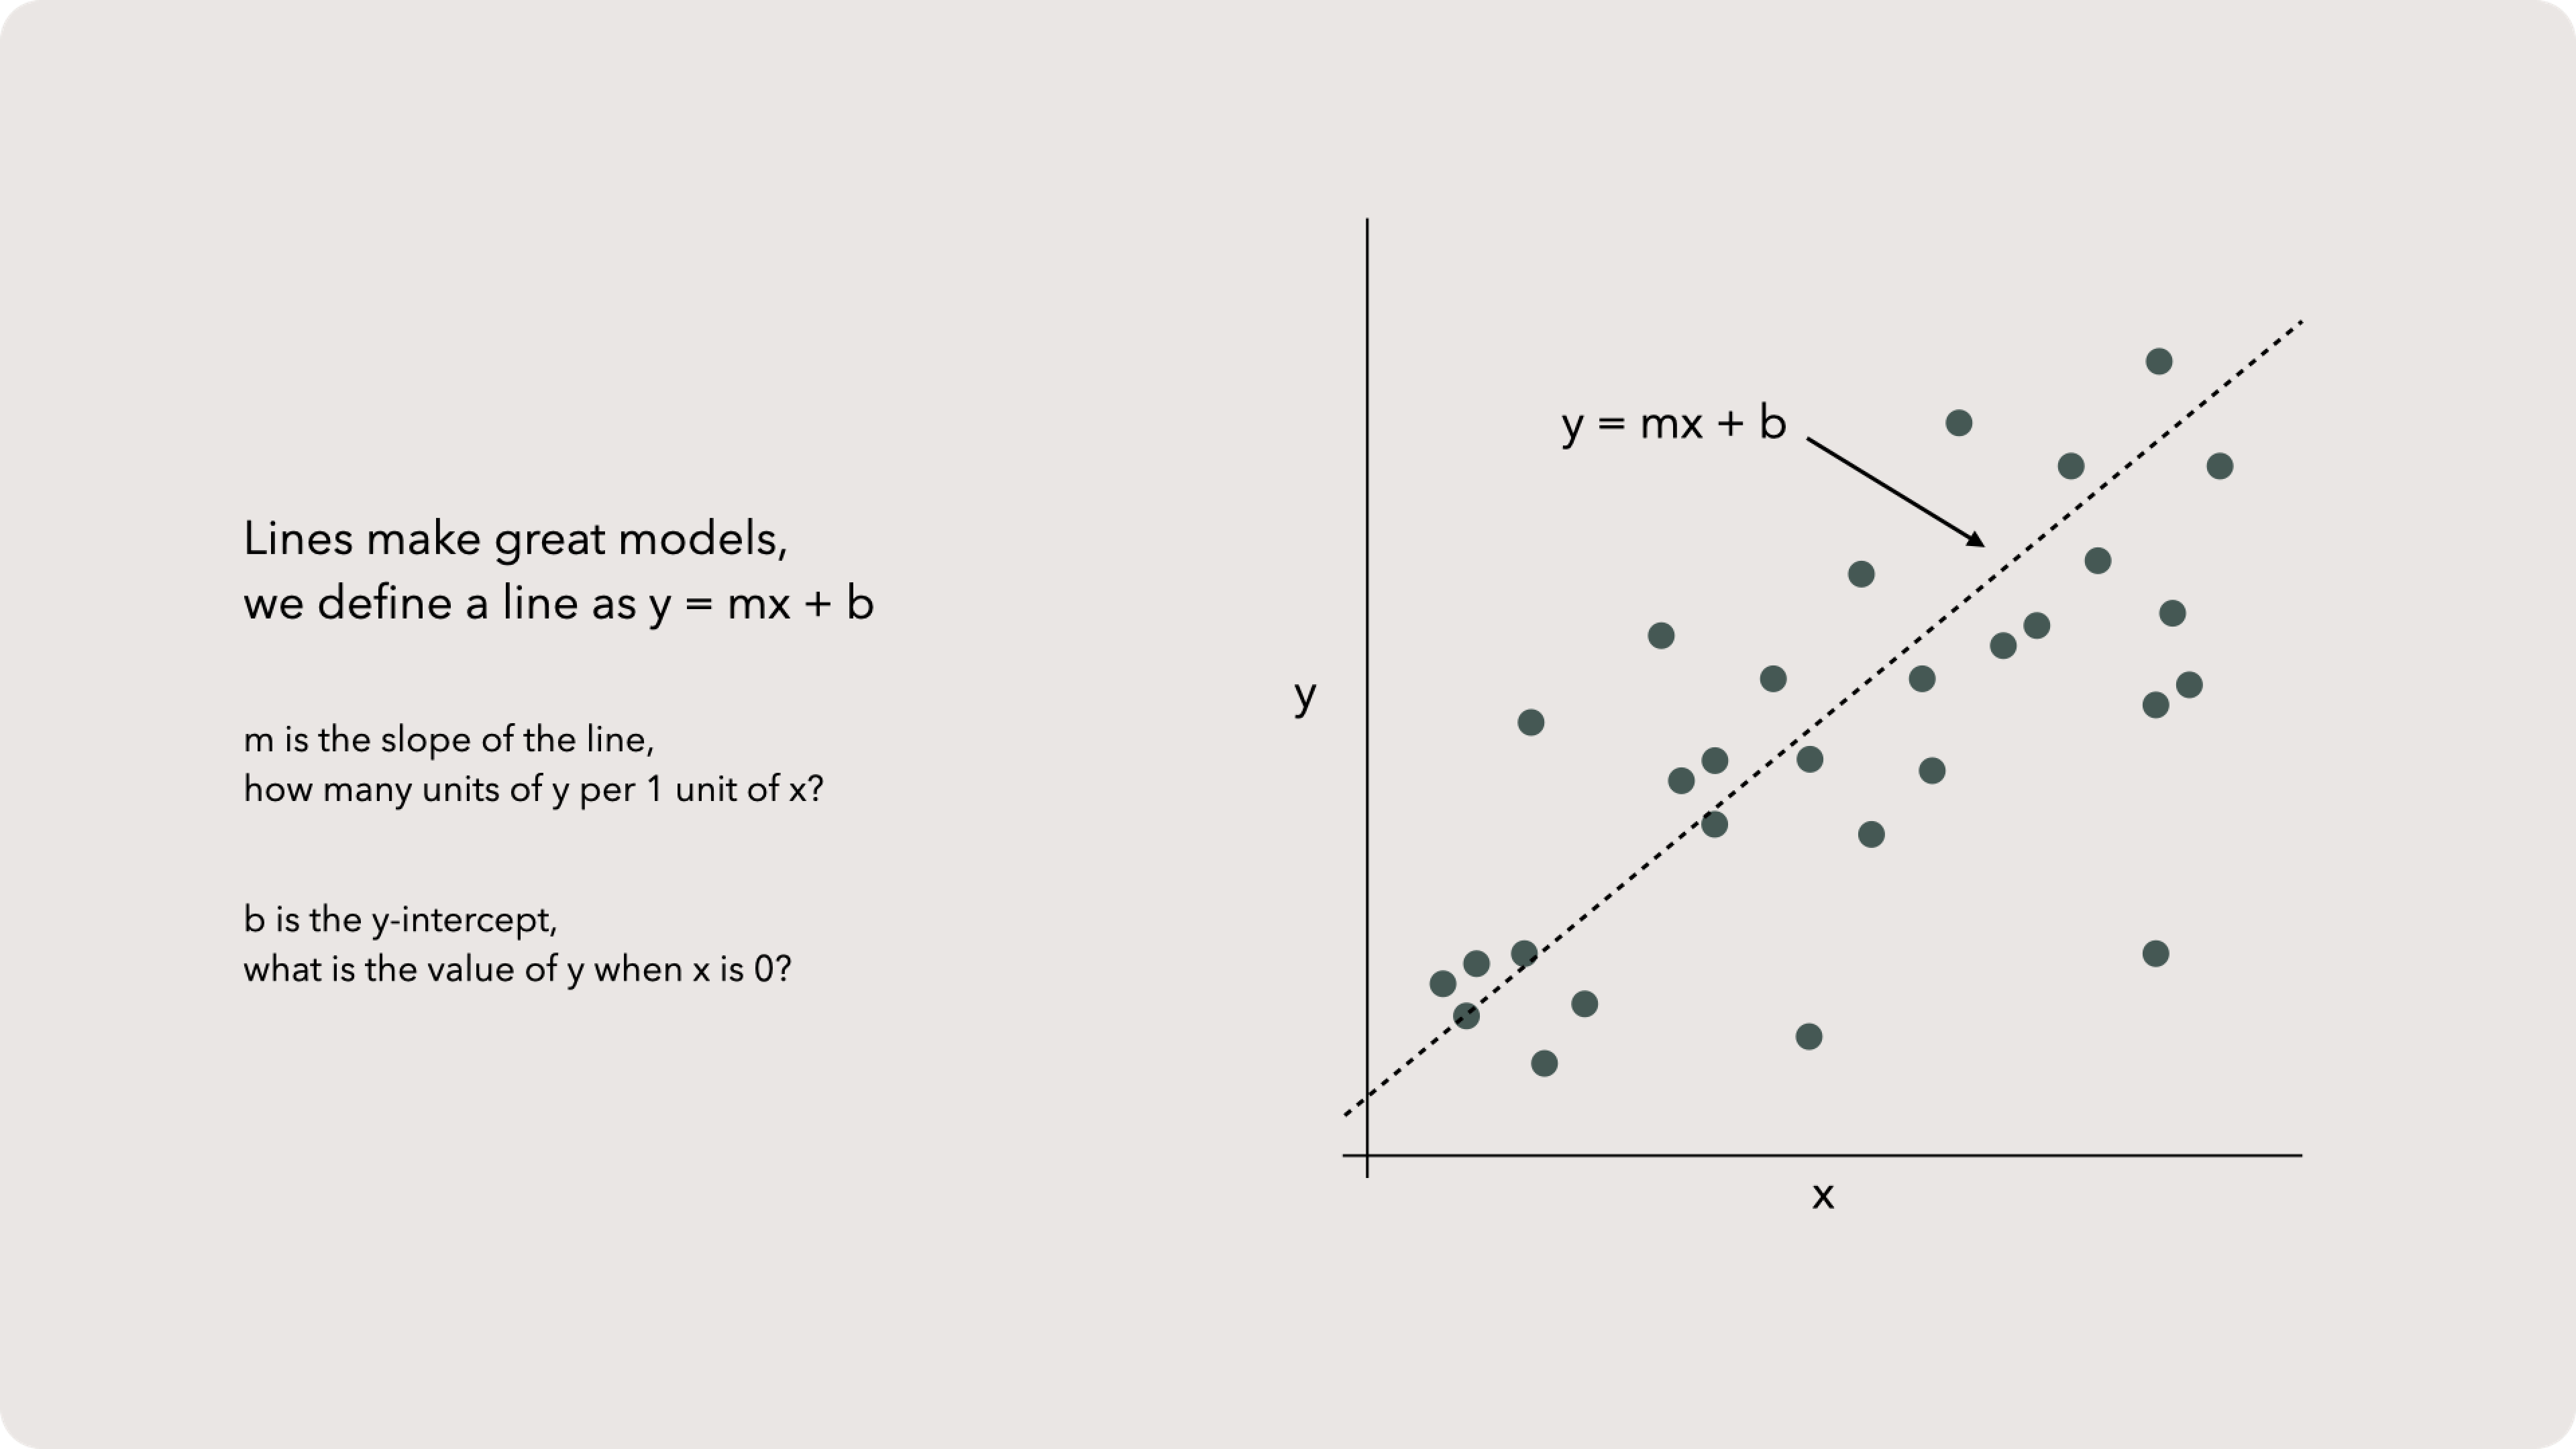
As m, the slope, grows, so does the steepness of the line. The slope’s multiplicative effect on x means it highly impacts the relationship between x and y.
The y-intercept, b, has less overall weight on the model. b offsets the y value by a fixed amount. The clearest example of this is when we set x to zero. That will wipe out m and x, just leaving y = b. Another way to say this is: our line will cross the y-axis at b when x = 0.
Residuals
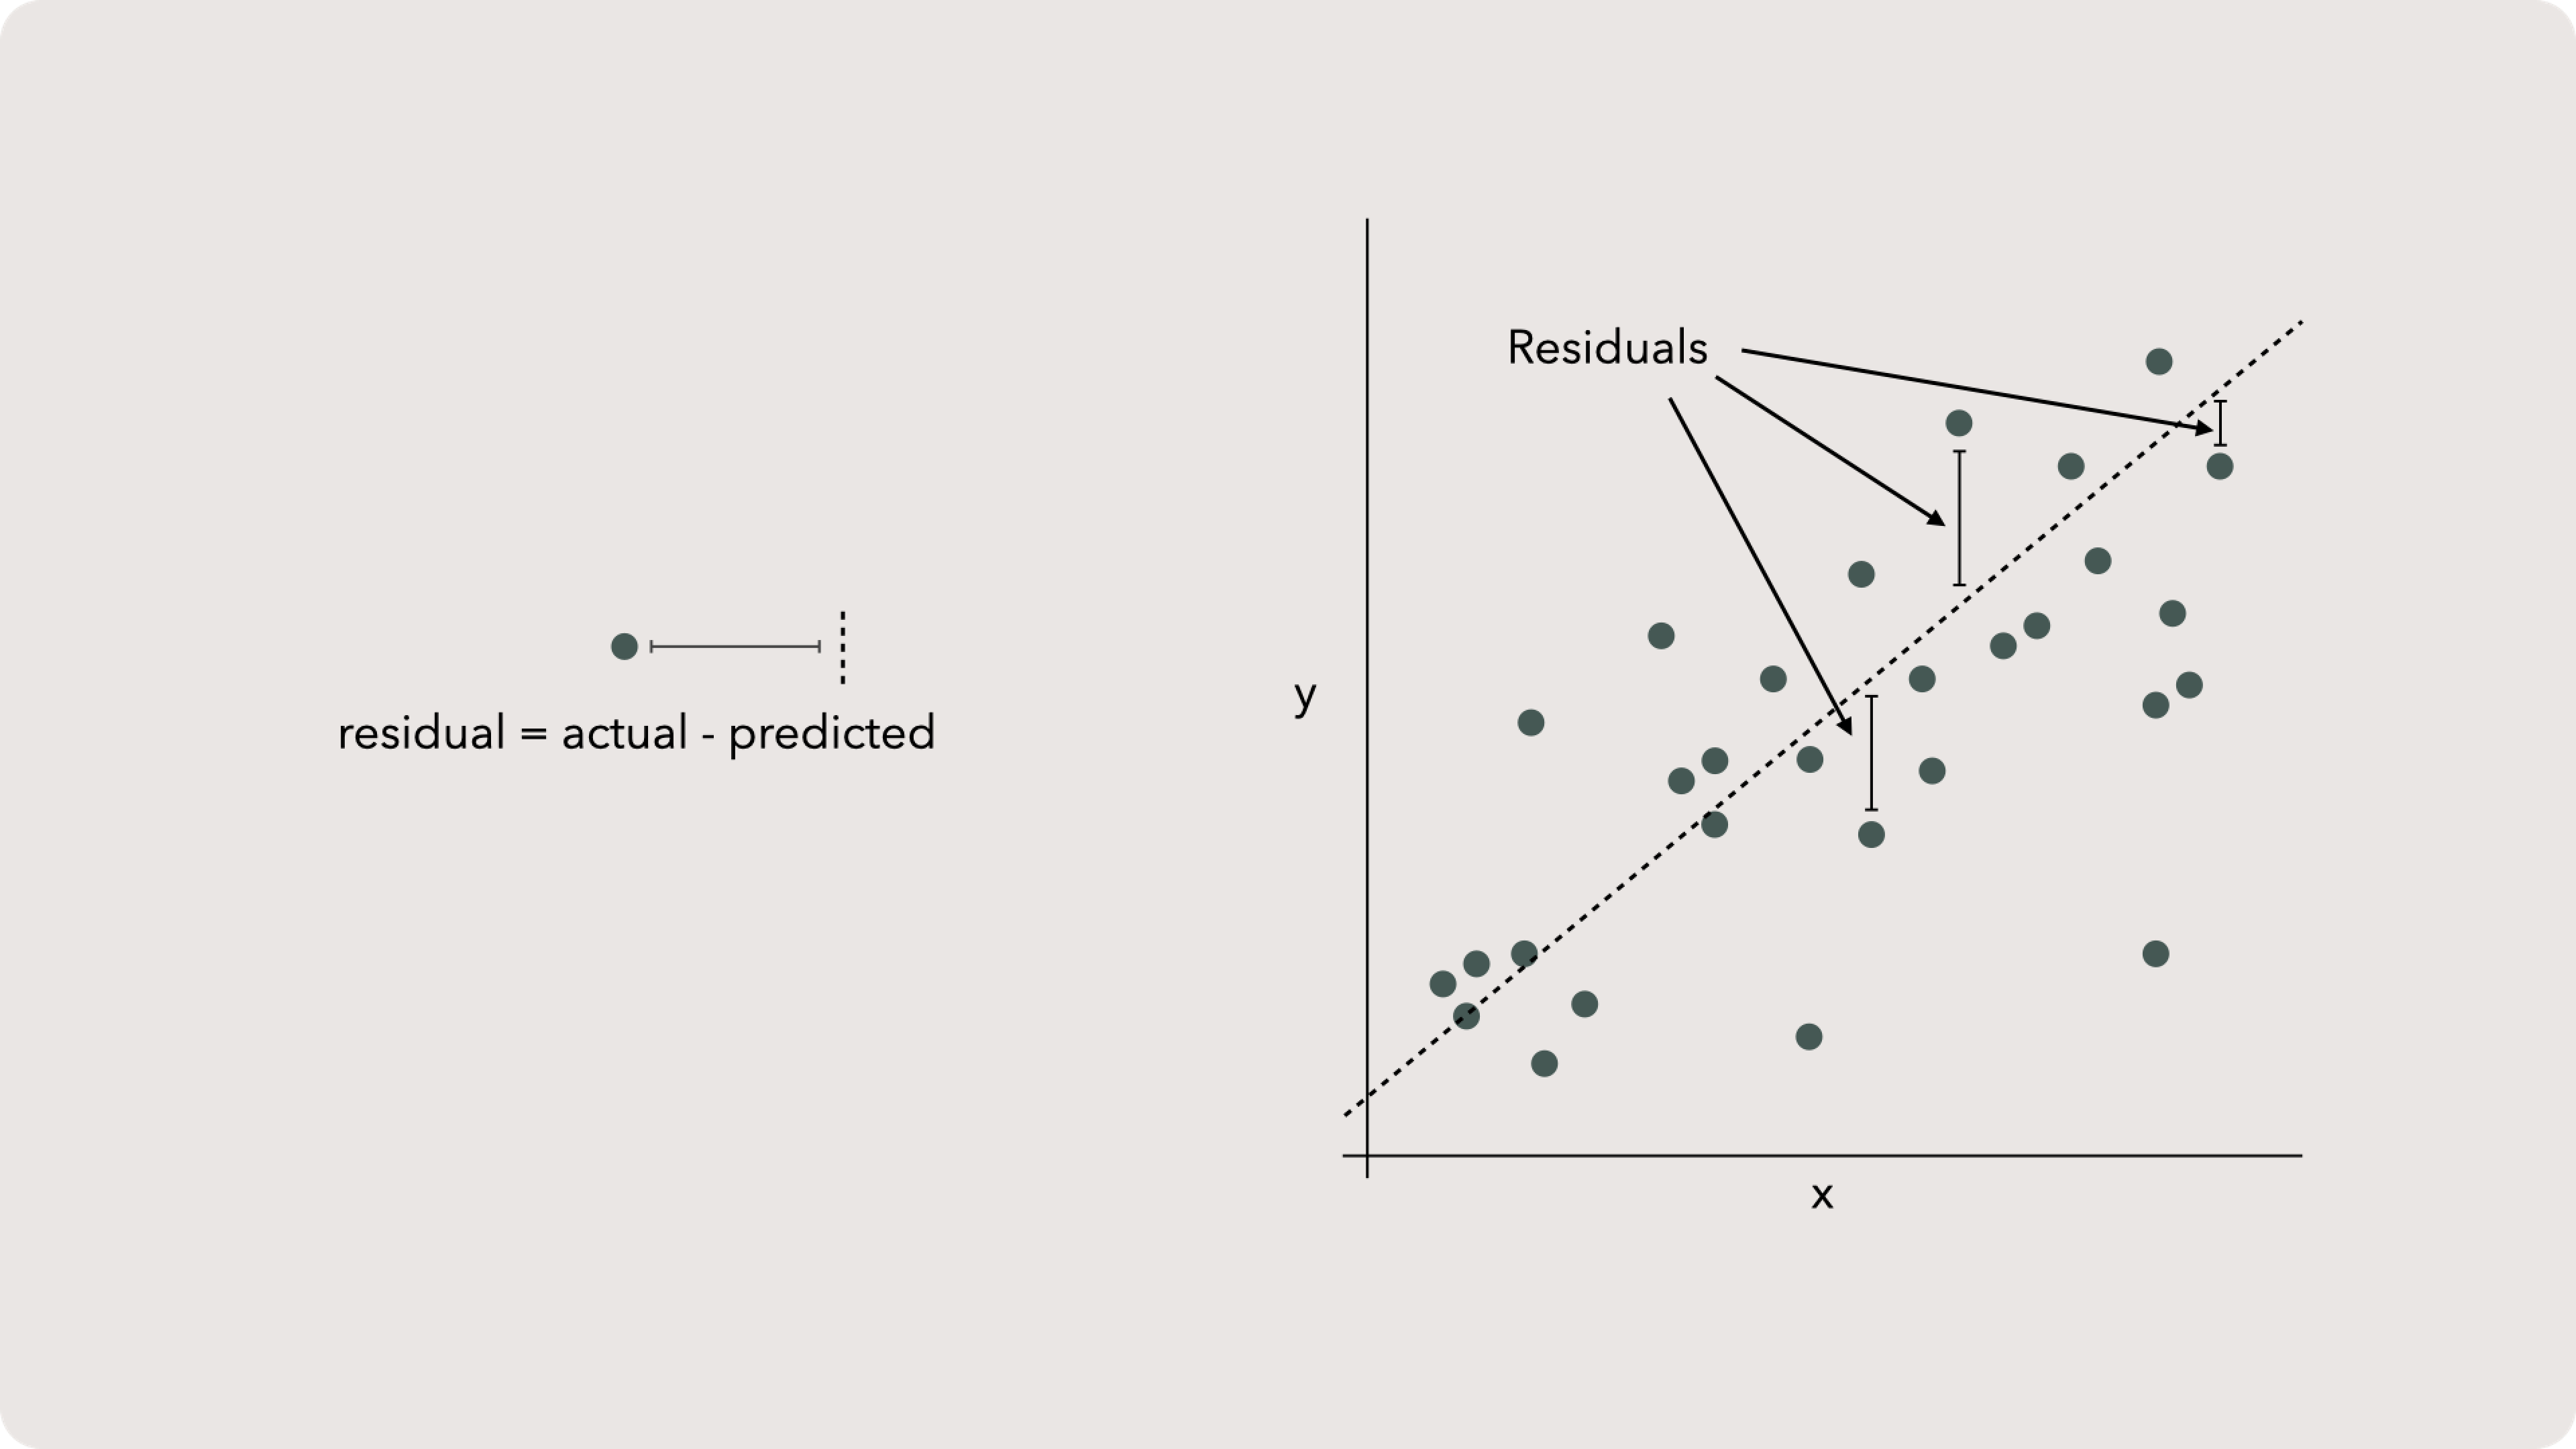
Residuals are the answer. A residual is the difference between the value estimated by our line and the actual value we observed. The residual is a one-to-one measurement, meaning for each observation, we have a residual. It isn’t an aggregated tool like median.
Residuals can be positive or negative but, in general, most folks talk about residuals as an absolute value. Although honestly, residuals are a powerful waypoint and rarely discussed by themselves.
Finally, it's important to note: we often casually talk about error as the difference between a real and expected value. From a technical standpoint error cannot be directly measured as it is the difference between our observed value and the real value. The observed values are our samples scattered over a plot but the real value can only be estimated and this estimation is from our observed data. If we could get “real” or “true” values from simple measurement then entire branches of statistics would be unnecessary. So the error we more commonly talk about is actually the residual, meaning the difference between our observed and predicted values. You can see how these two can be confused and, in fact, some of the metrics we are about to use make this very mistake.
Error metrics
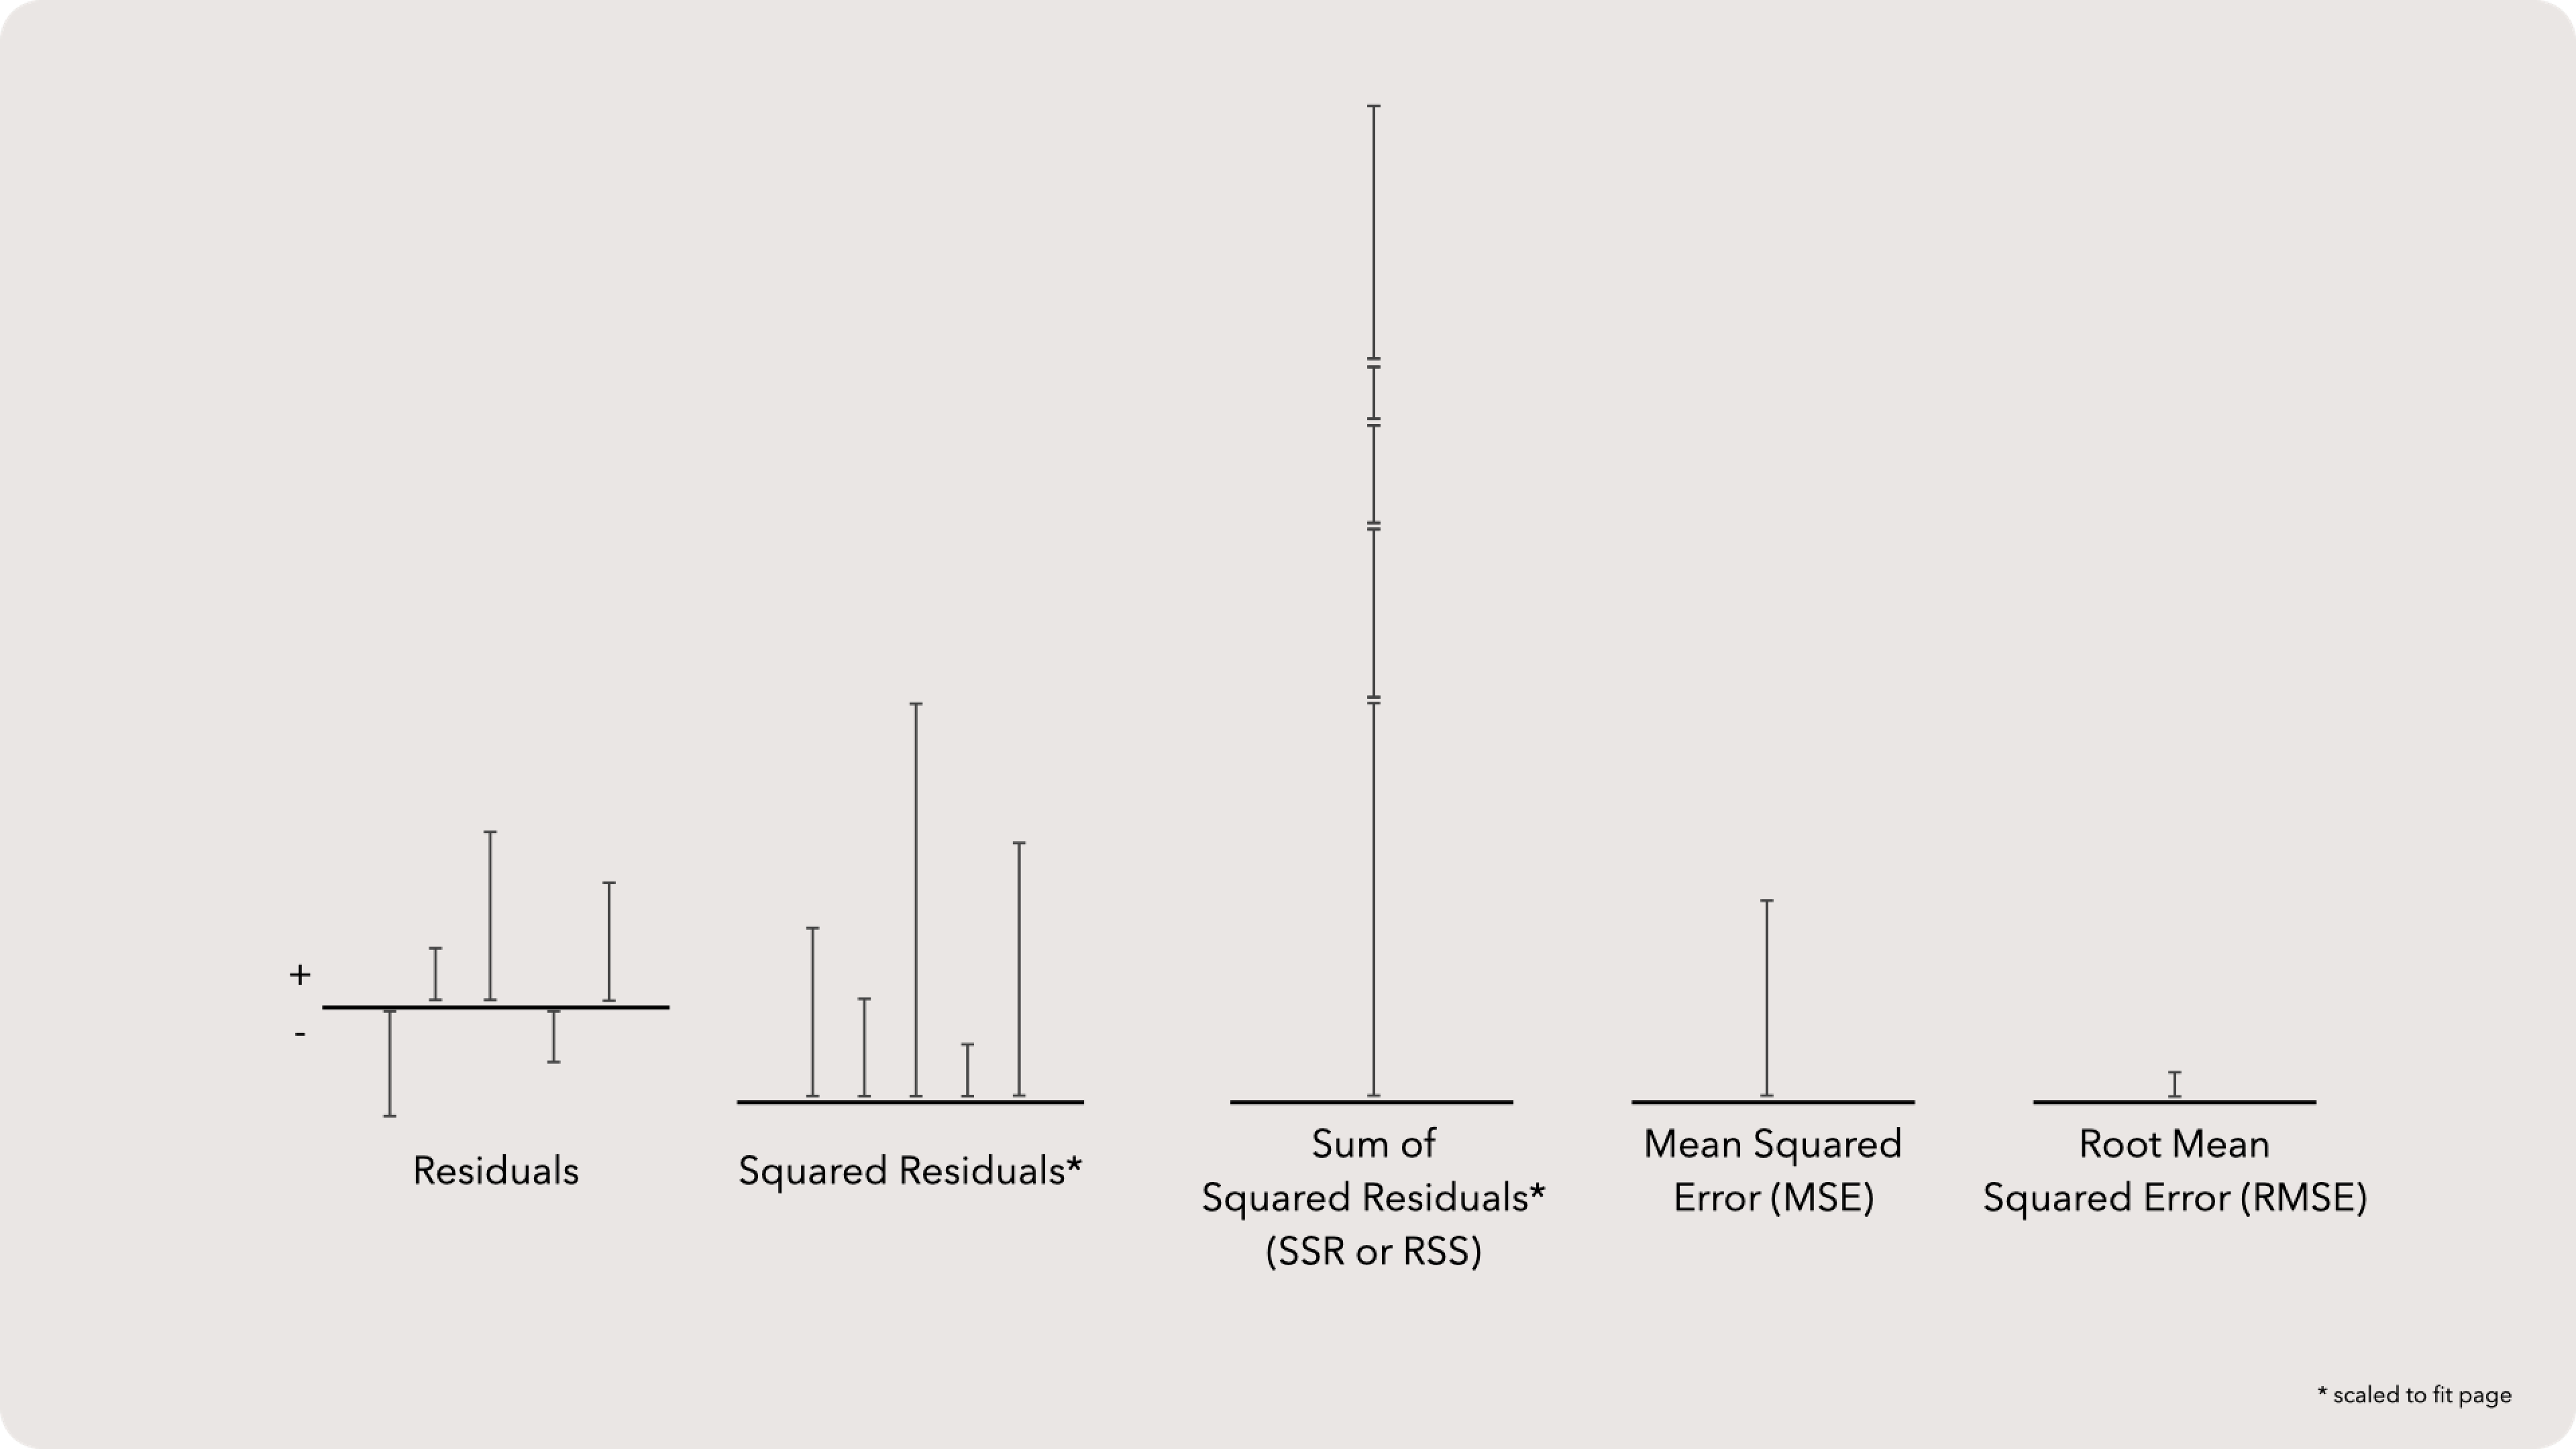
We often first transform residuals to squared residuals which will make all values positive. Then we add all residuals for a model up to create Sum of Squared Residuals. Some statisticians call this SSR, but most call it RSS. Either way, this metric describes the overall quality of the model. A small SSR indicates that the model fits the observed data fairly well.
However, SSR is not a great metric to describe the model in the units of our data. Remember, we squared and summed the value, so SSR is going to be a lot larger than any given observation.
We can bring it back down to our observables units by first dividing SSR by the total number of samples. This yields the Mean Squared Error (MSE). Then, taking the square root of MSE will finally provide us with a useable metric called the Root Mean Squared Error (RMSE). Just like SSR, a small RMSE also describes a better fit. However, we can use the RMSE as a “central measure” of our error.
That is, we could say that RMSE is “the average distance between our predicted and observed values.“ This is even slightly wrong, but good enough to paint the picture: RMSE reflects the average difference between our model and data. A bigger RMSE means our model isn’t great.
These metrics both technically misuse the word ‘error’. Sure, we all know what is meant and it is totally fine, but the pedant in me wants these measures called Root Mean of Squared Residuals. But evidently the society of statisticians has stopped reading my emails.
SSR comparison
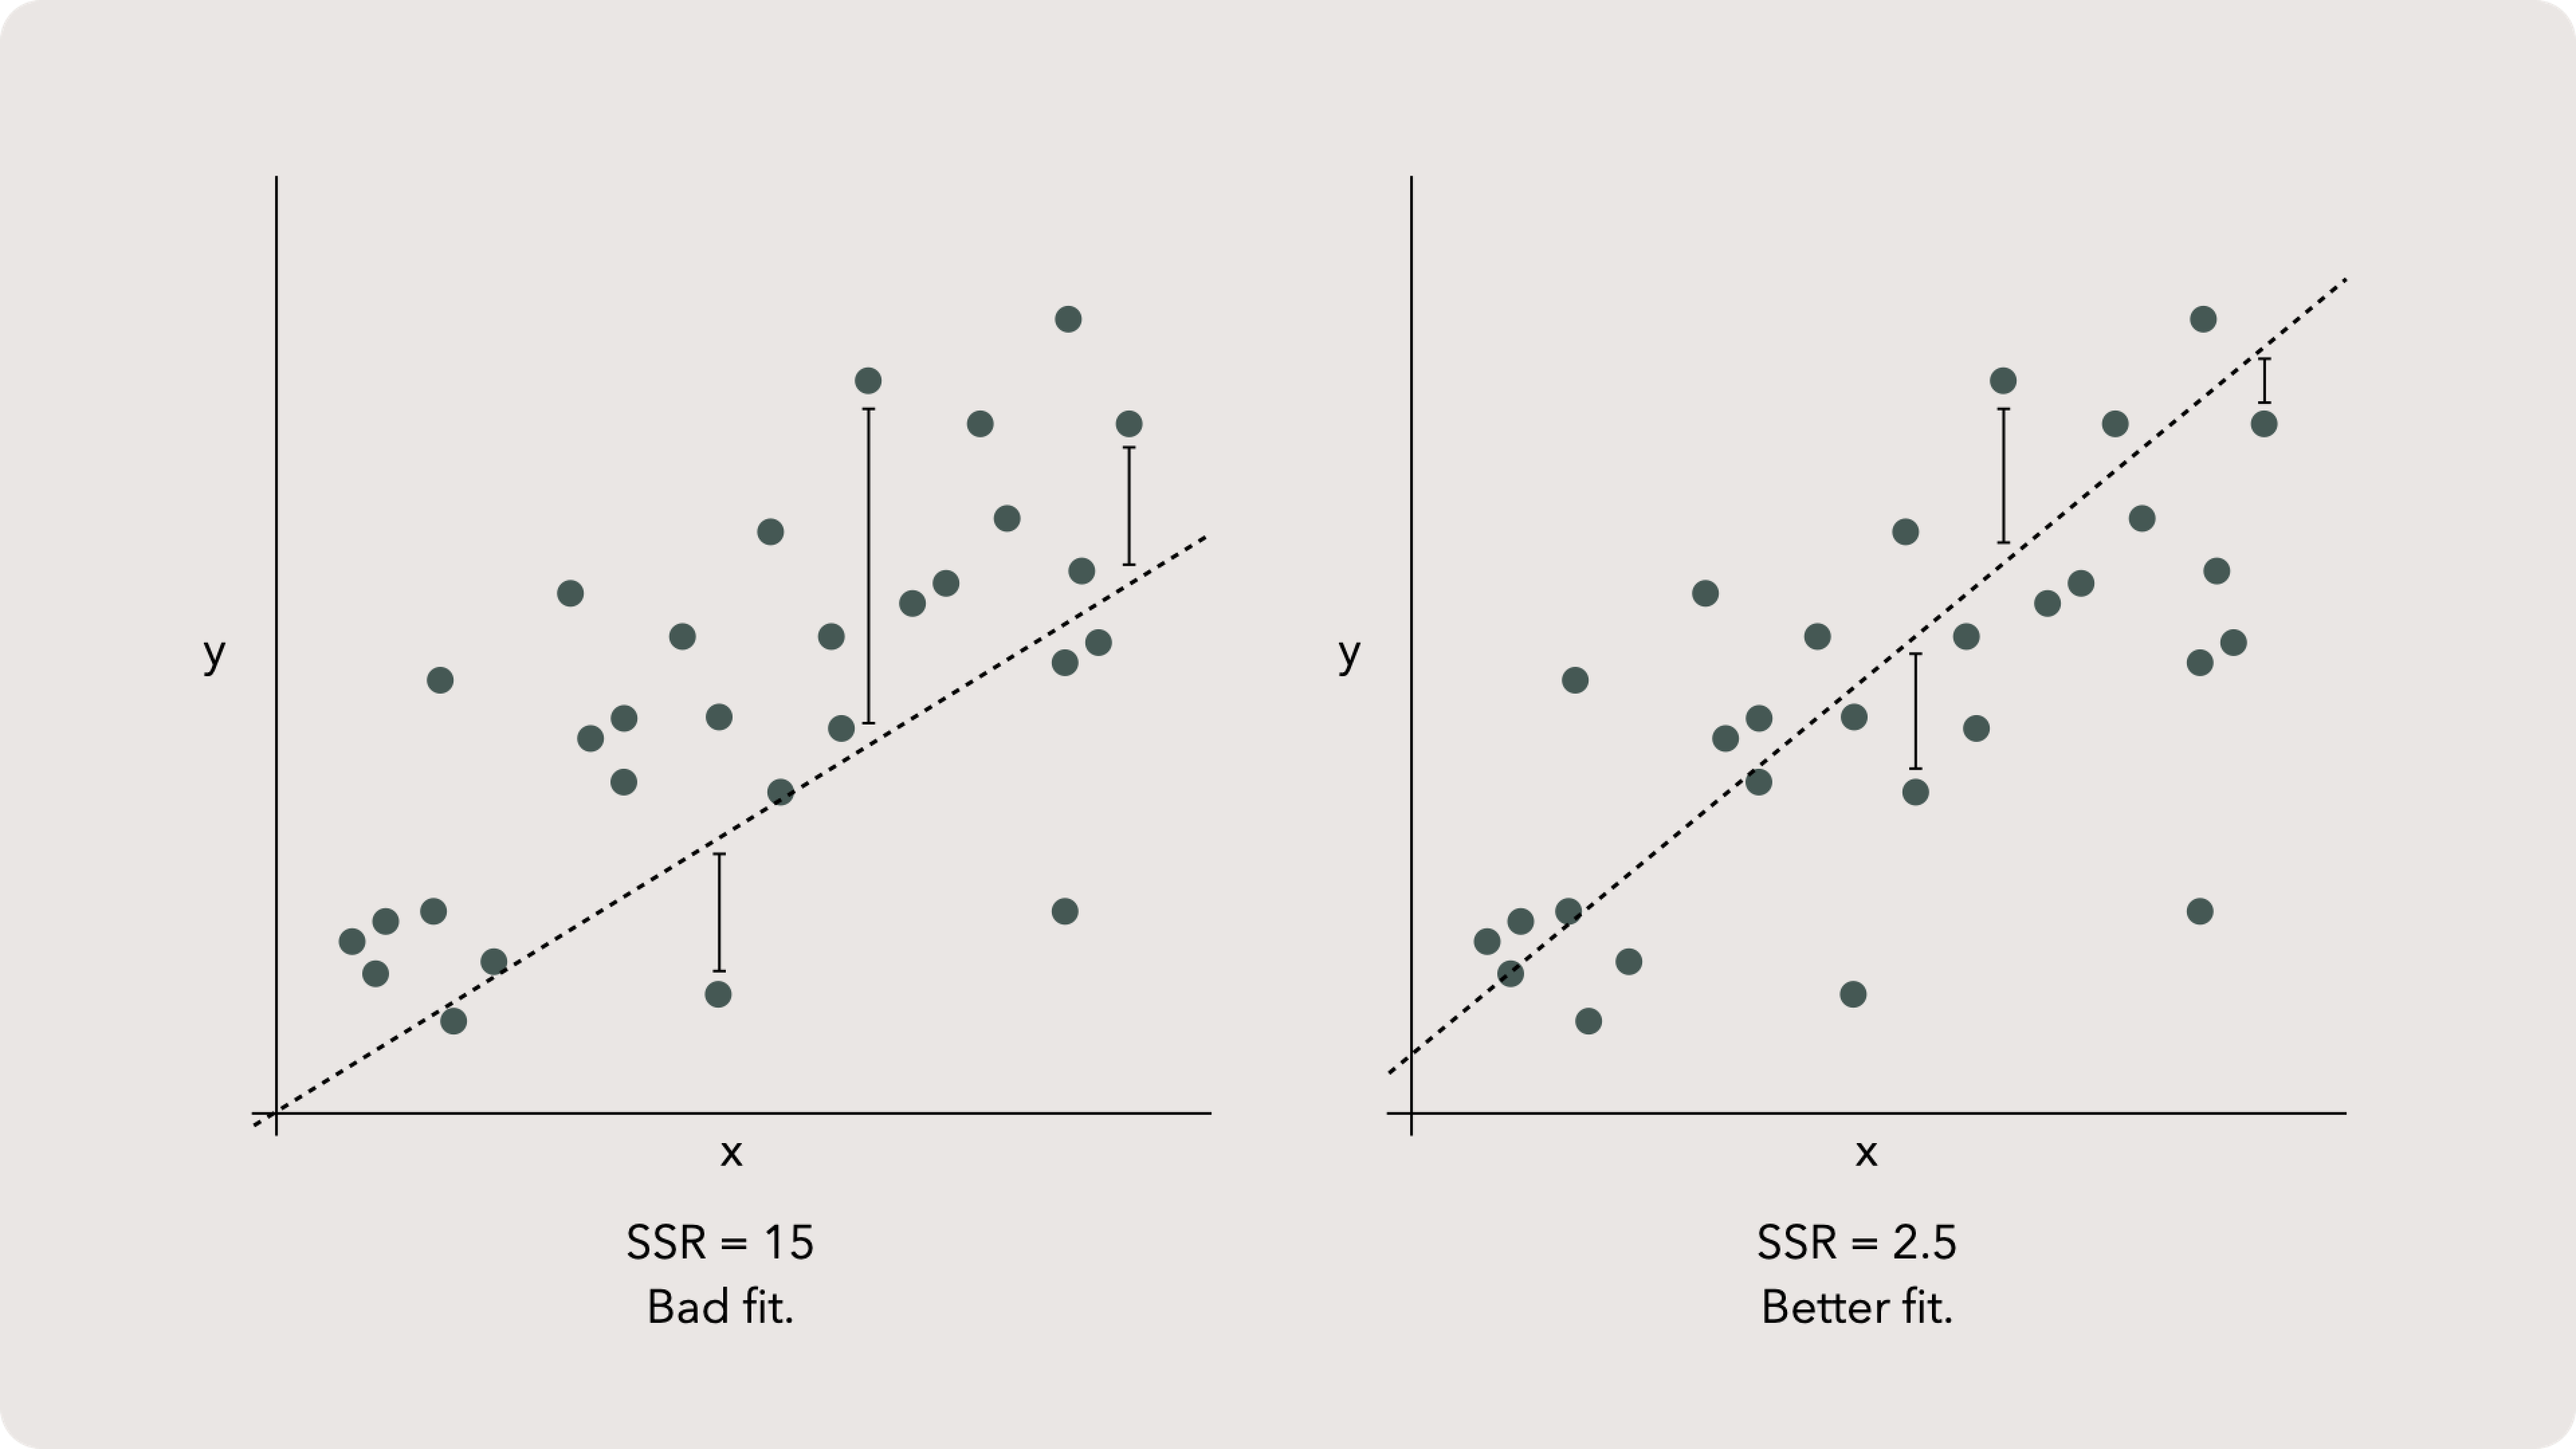
As previously mentioned, a smaller SSR indicates a better fit. But that is only when comparing a model with identical features. SSR doesn’t really work to compare models using different metrics.
R-squared transition

R-squared definition
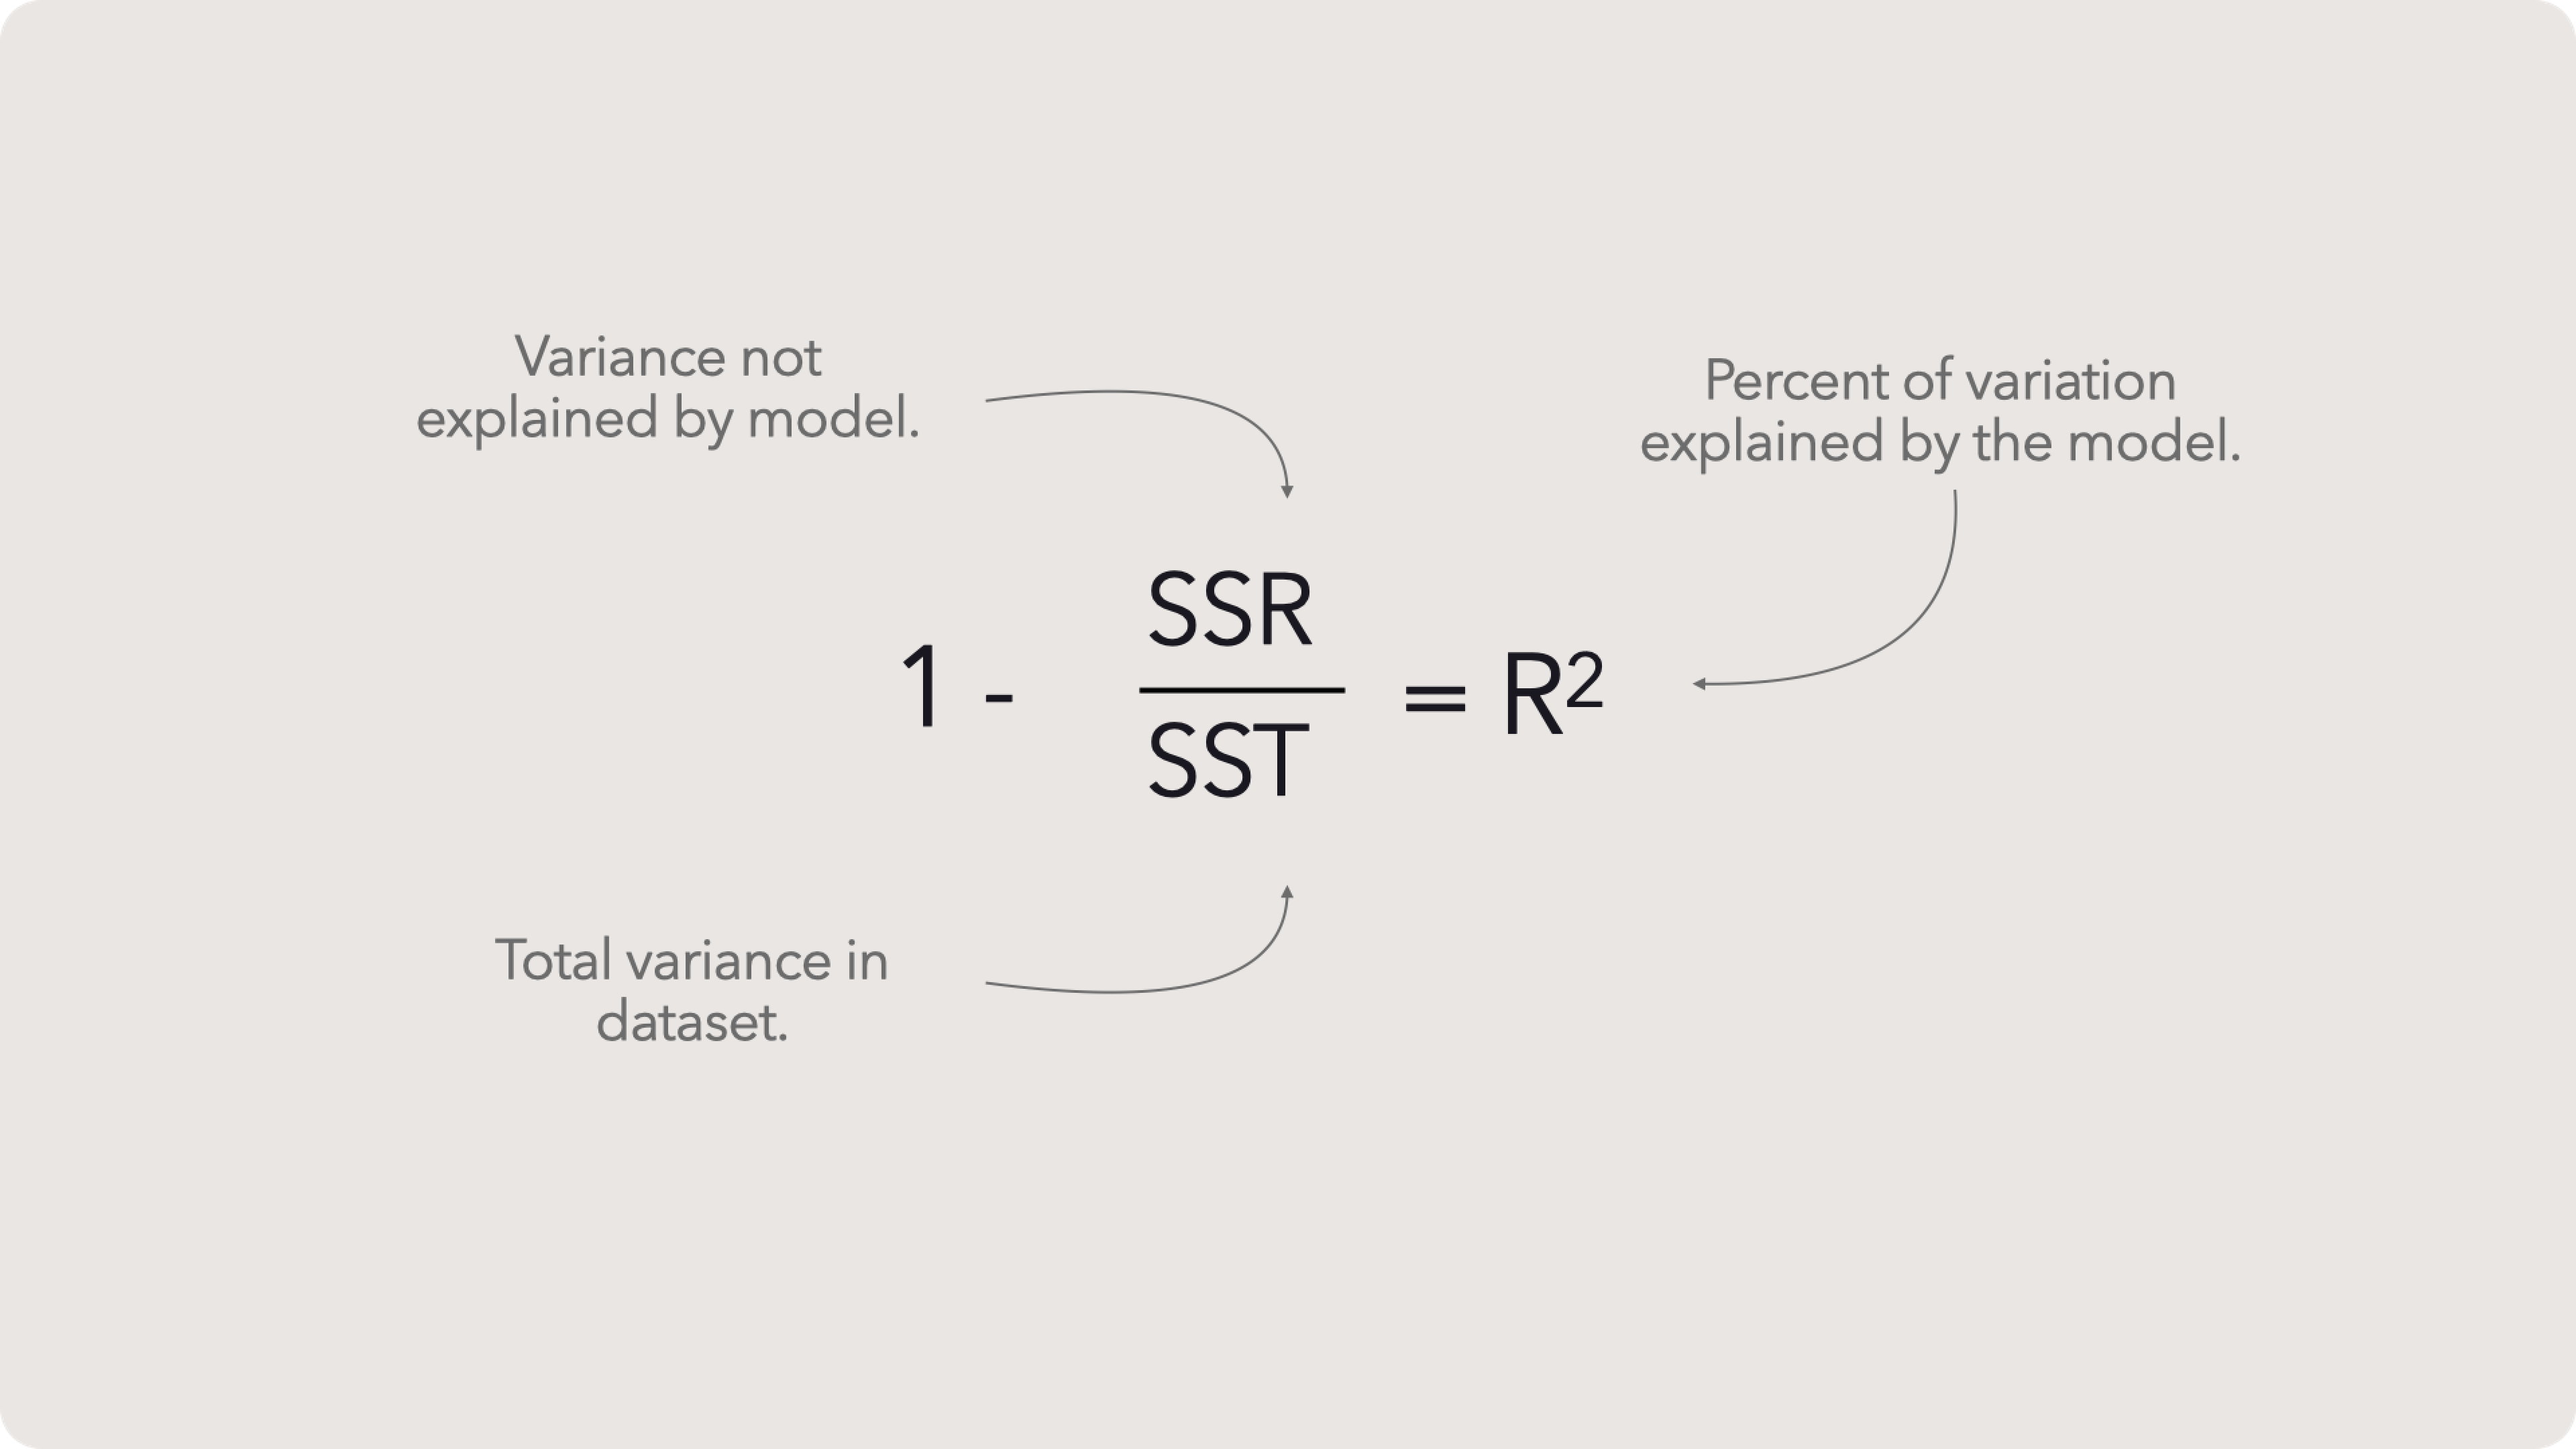
If we take that variance and divide it by all the variation in the dataset then subtract 1 from that decimal, we would get a ratio of all the variation explained by our model.
Wait, what?
Ok, imagine we made a perfect model. The parameters selected explain perfectly how Y changes with X. The data does vary but in a perfectly straight line which our model captures flawlessly. This perfect model explains all the variance. But this is but a pipe dream, as we will never have that (more on this in just a second). So instead we need to account for why our observed value is just a bump above our linear model. Or why a few values scatter away from the rest. This is our unexplained variance neatly captured as SSR. When we divide SSR by SST, we get the amount of variation that we can’t explain. That is useful but not as intuitive as the amount of variation we can explain, which is simply 100% less the % we don’t know, or 1 - SSR / SST.
R-squared comparison
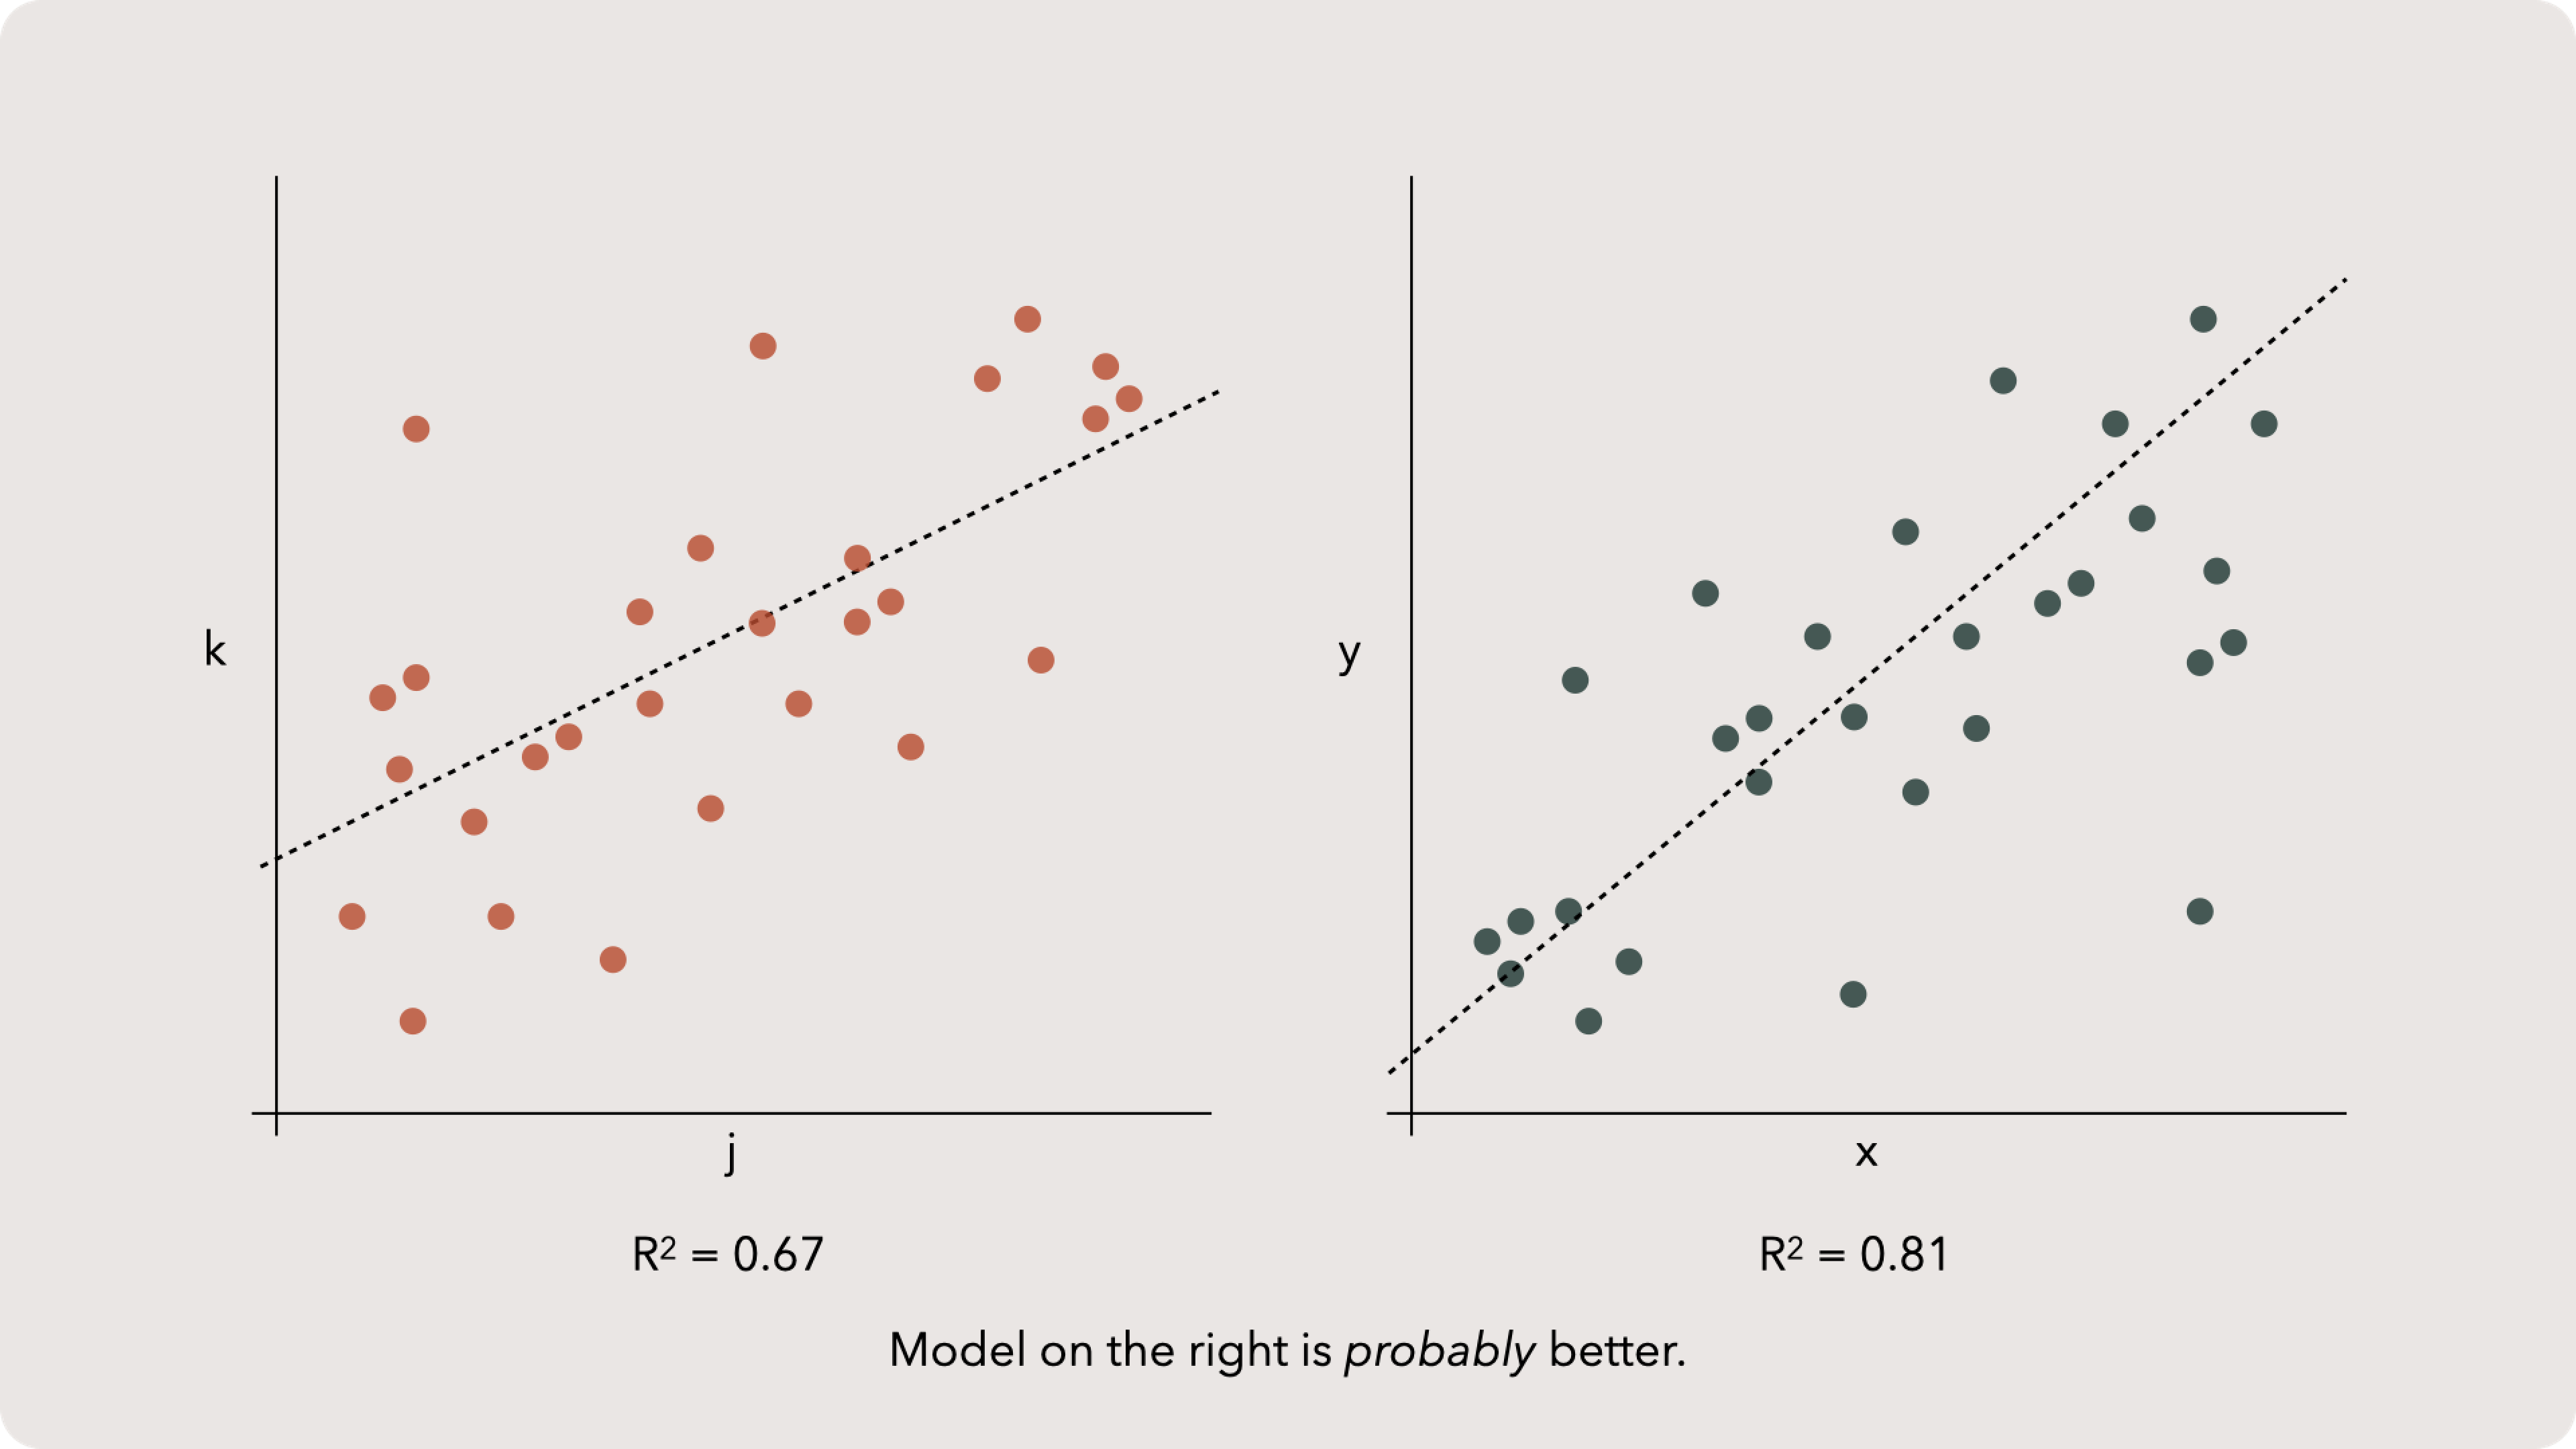
That said, neither R^2 nor SSR are ideal for comparing models built with different features. If we only have R^2 and SSR then would could probably state that the model with the higher R^2 is better, but Model Selection is a whole different topic which we will touch on again at the end of the chapter.
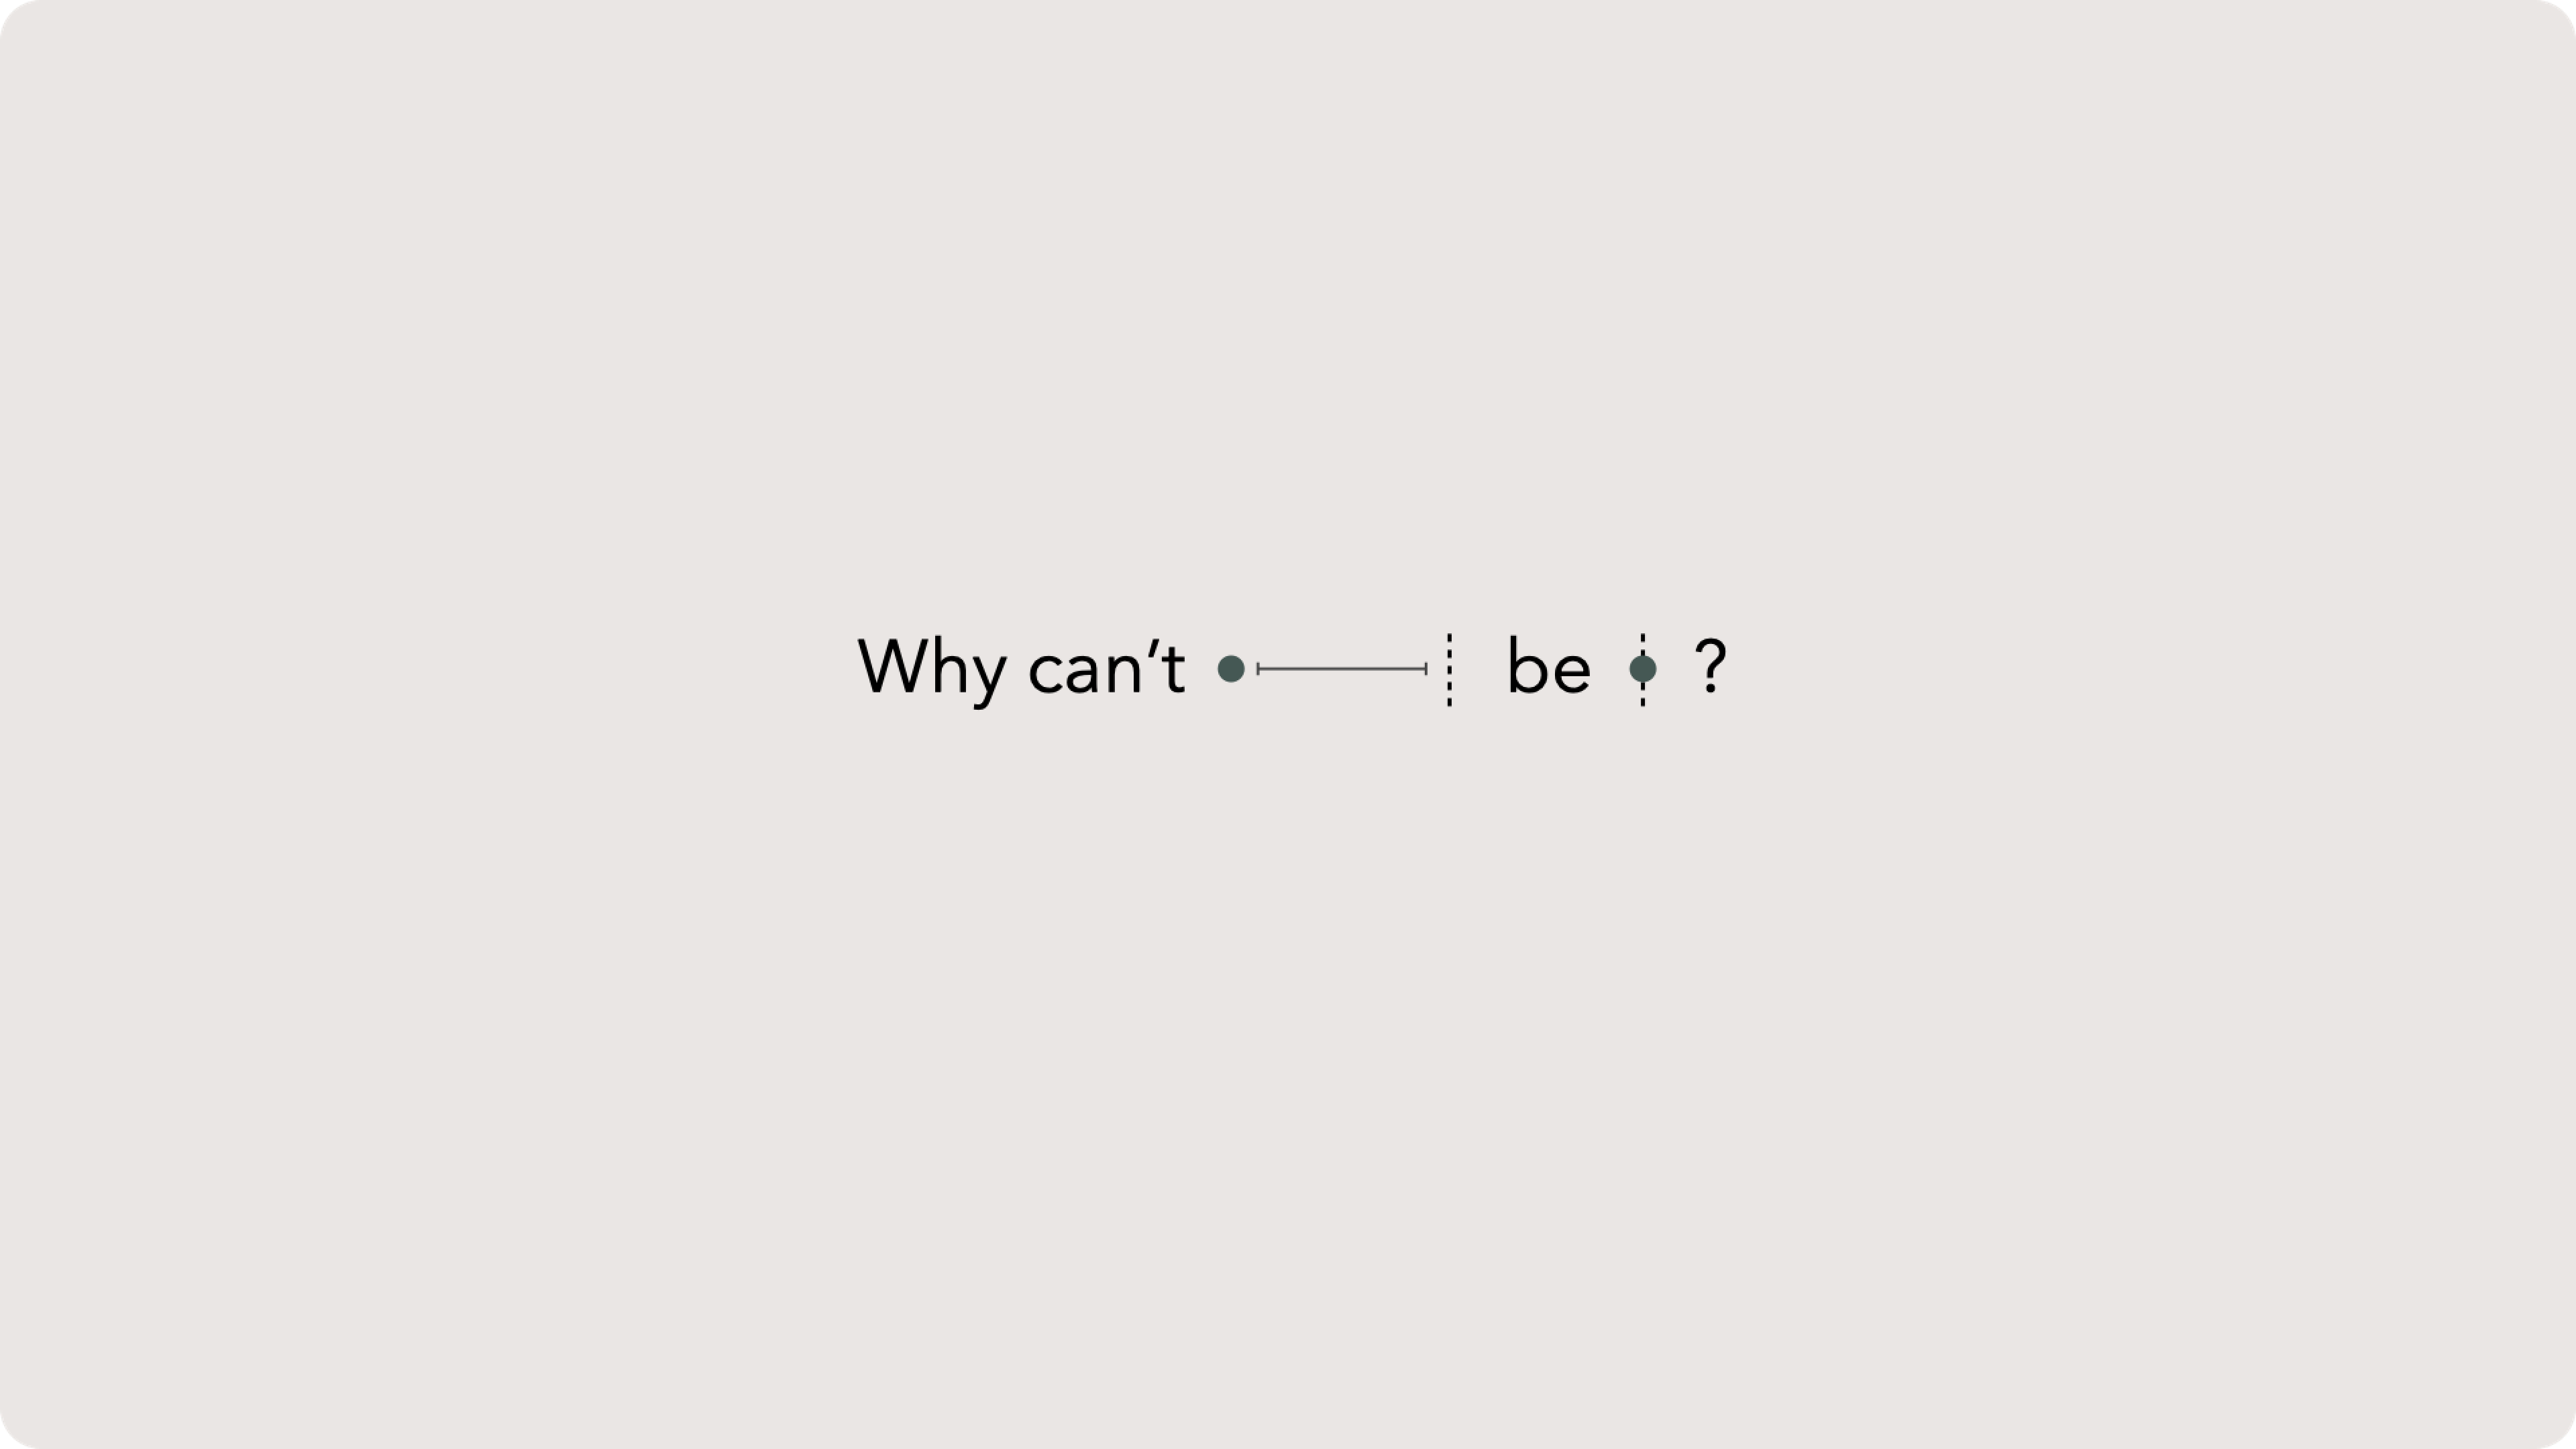
Why can't models be perfect?
Noisy data
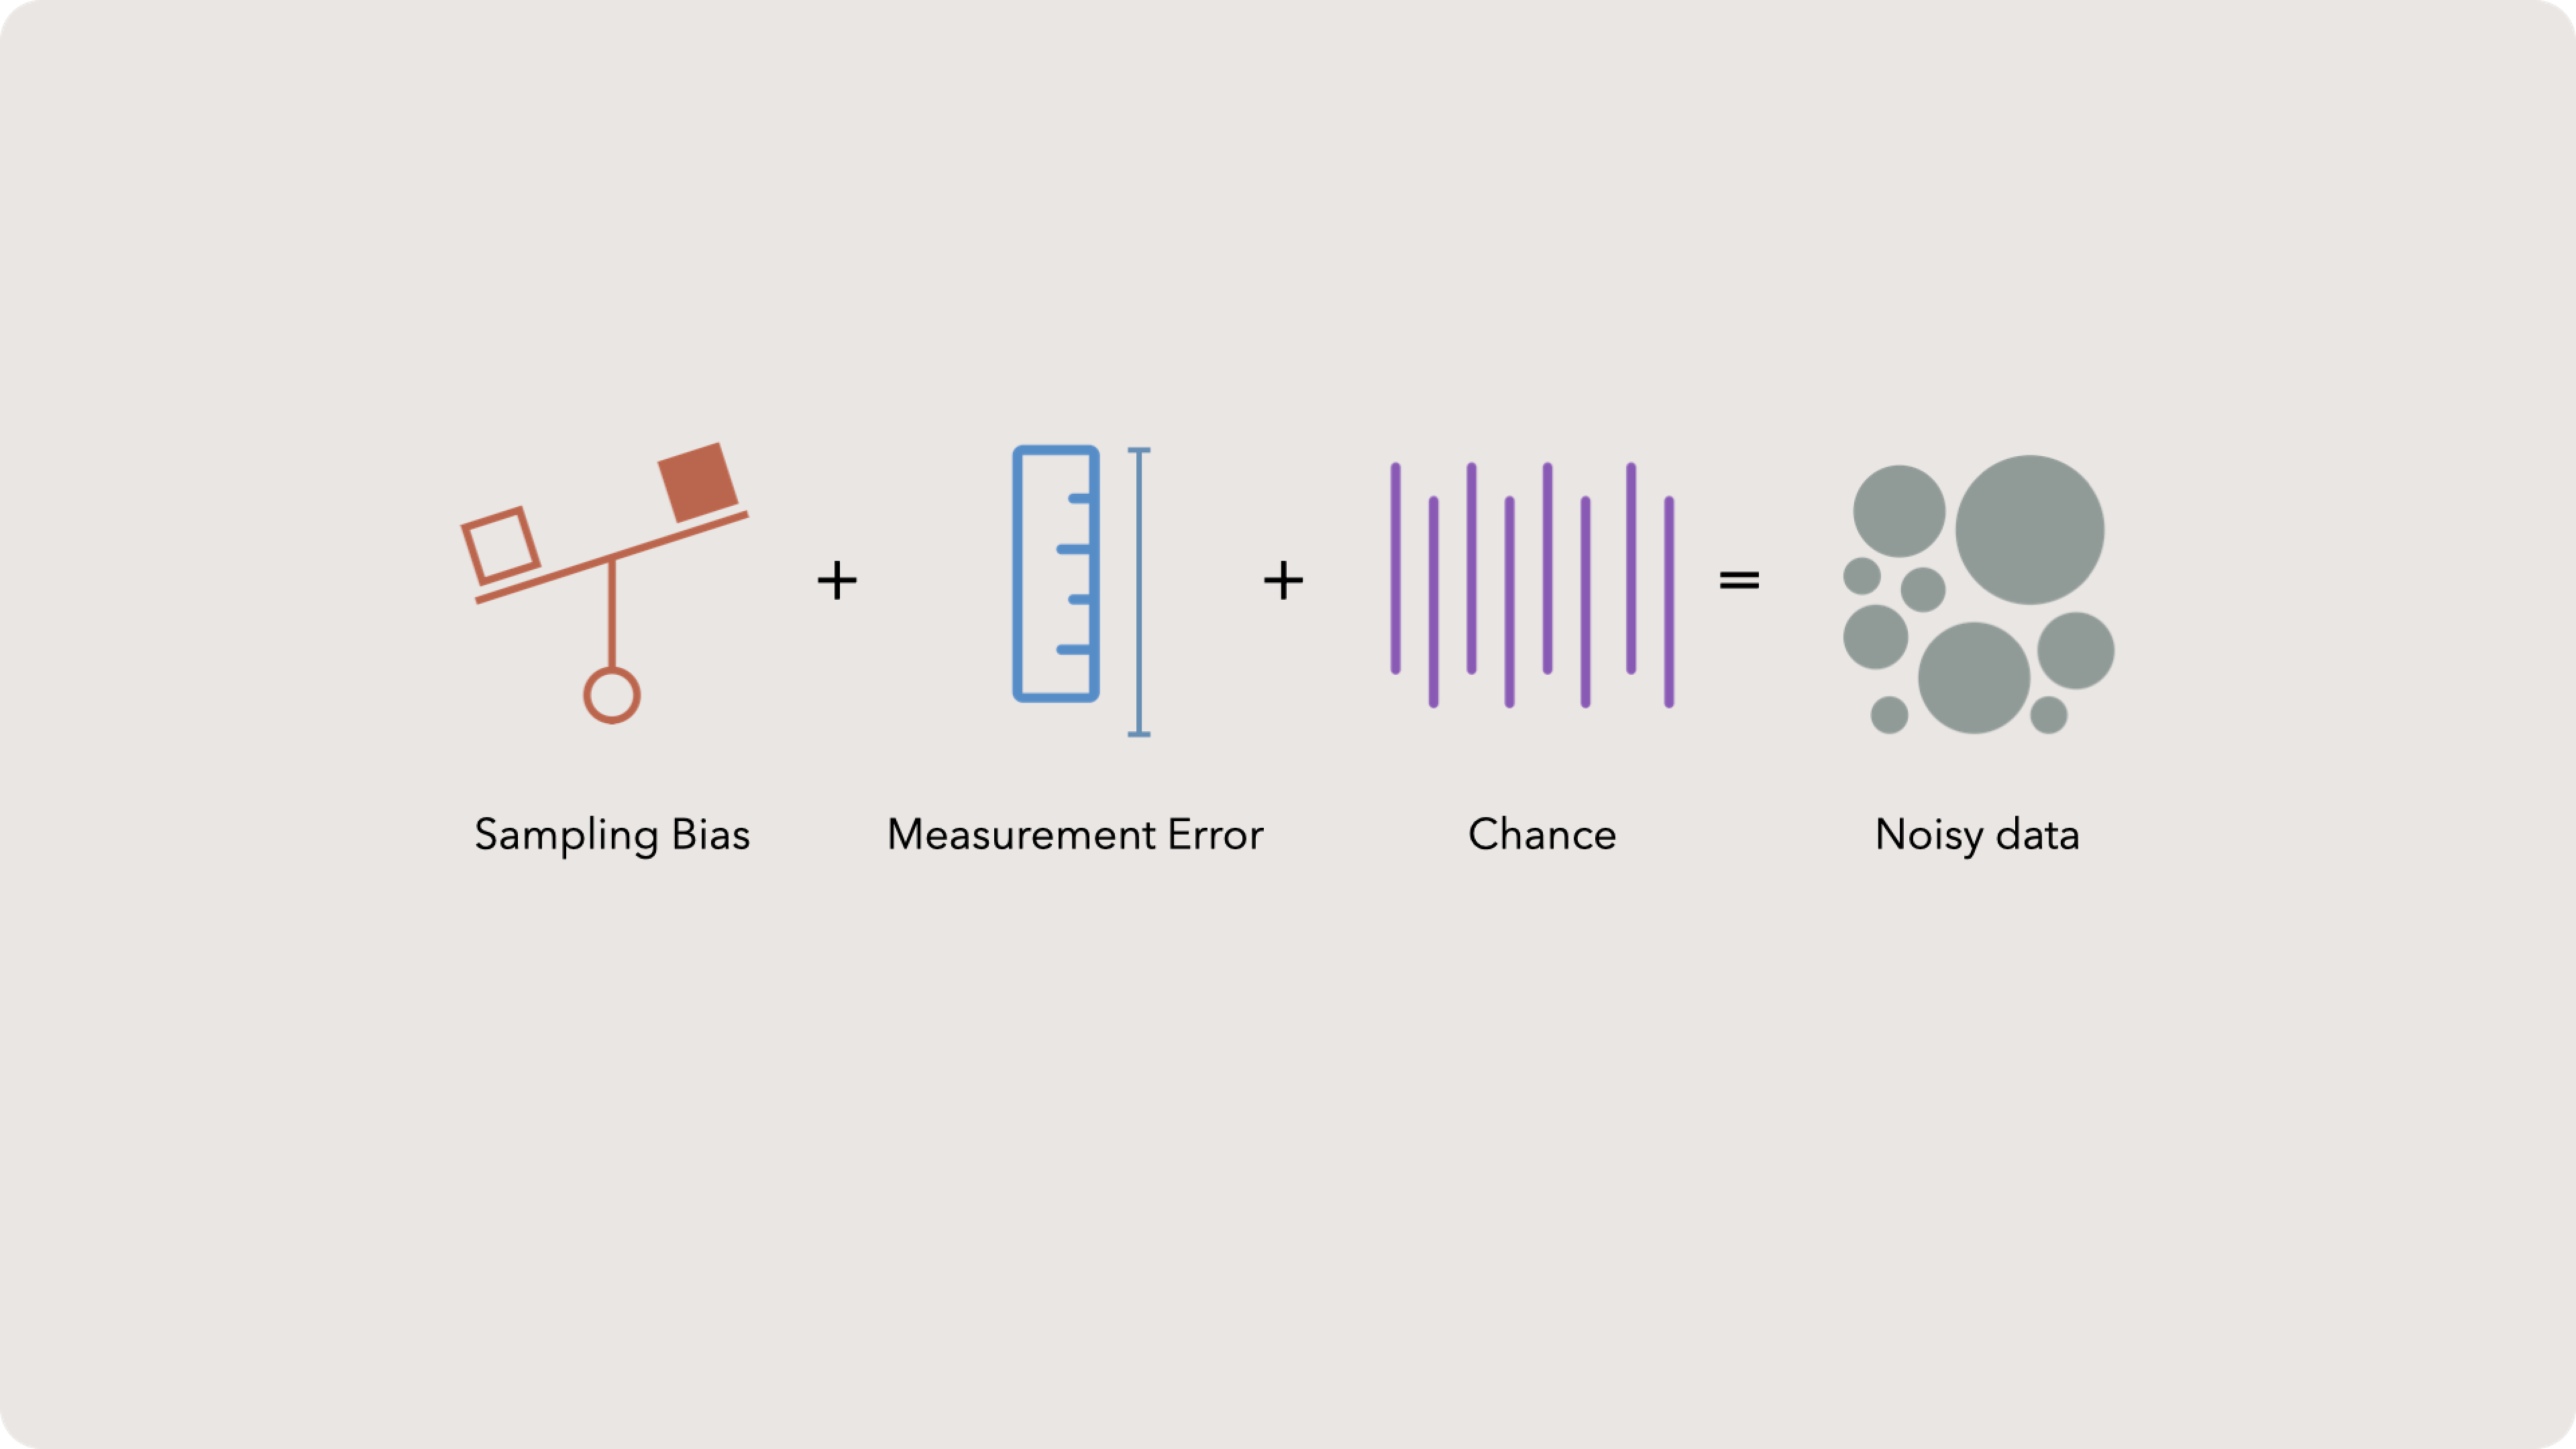
Sampling bias is a common issue. In essence, humans have thoughts which influence observations. Perhaps in a survey, we threw out a legitimate sample because we thought the participant was joking. In practice, sampling bias is much more subtle and essentially part of every dataset. This is why the notion of scientific reproducibility is key. If other labs can’t get the same answer, then you have likely skewed the answer — even if you didn’t mean to.
Measurement error happens all the time. It could be that our measuring instrument is not exact or that a human transposed a digit. Either way, the observed value is recorded as slightly different because of an all too human mistake. Imagine writing down the weight of an atom as 0.564829 when the actual value is 0.564289. An easy mistake.
Finally, the world is not perfectly deterministic. Sometimes randomness just causes things to move a bit. The remedy to chance is larger sample sizes, but that isn’t always possible. Often your data will be tilted a bit by some unknown random process.
Finding the best line

But how do we actually find the best fitting line for our data? The good news is that we only have two parameters to play with, m and b .
Gradient descent
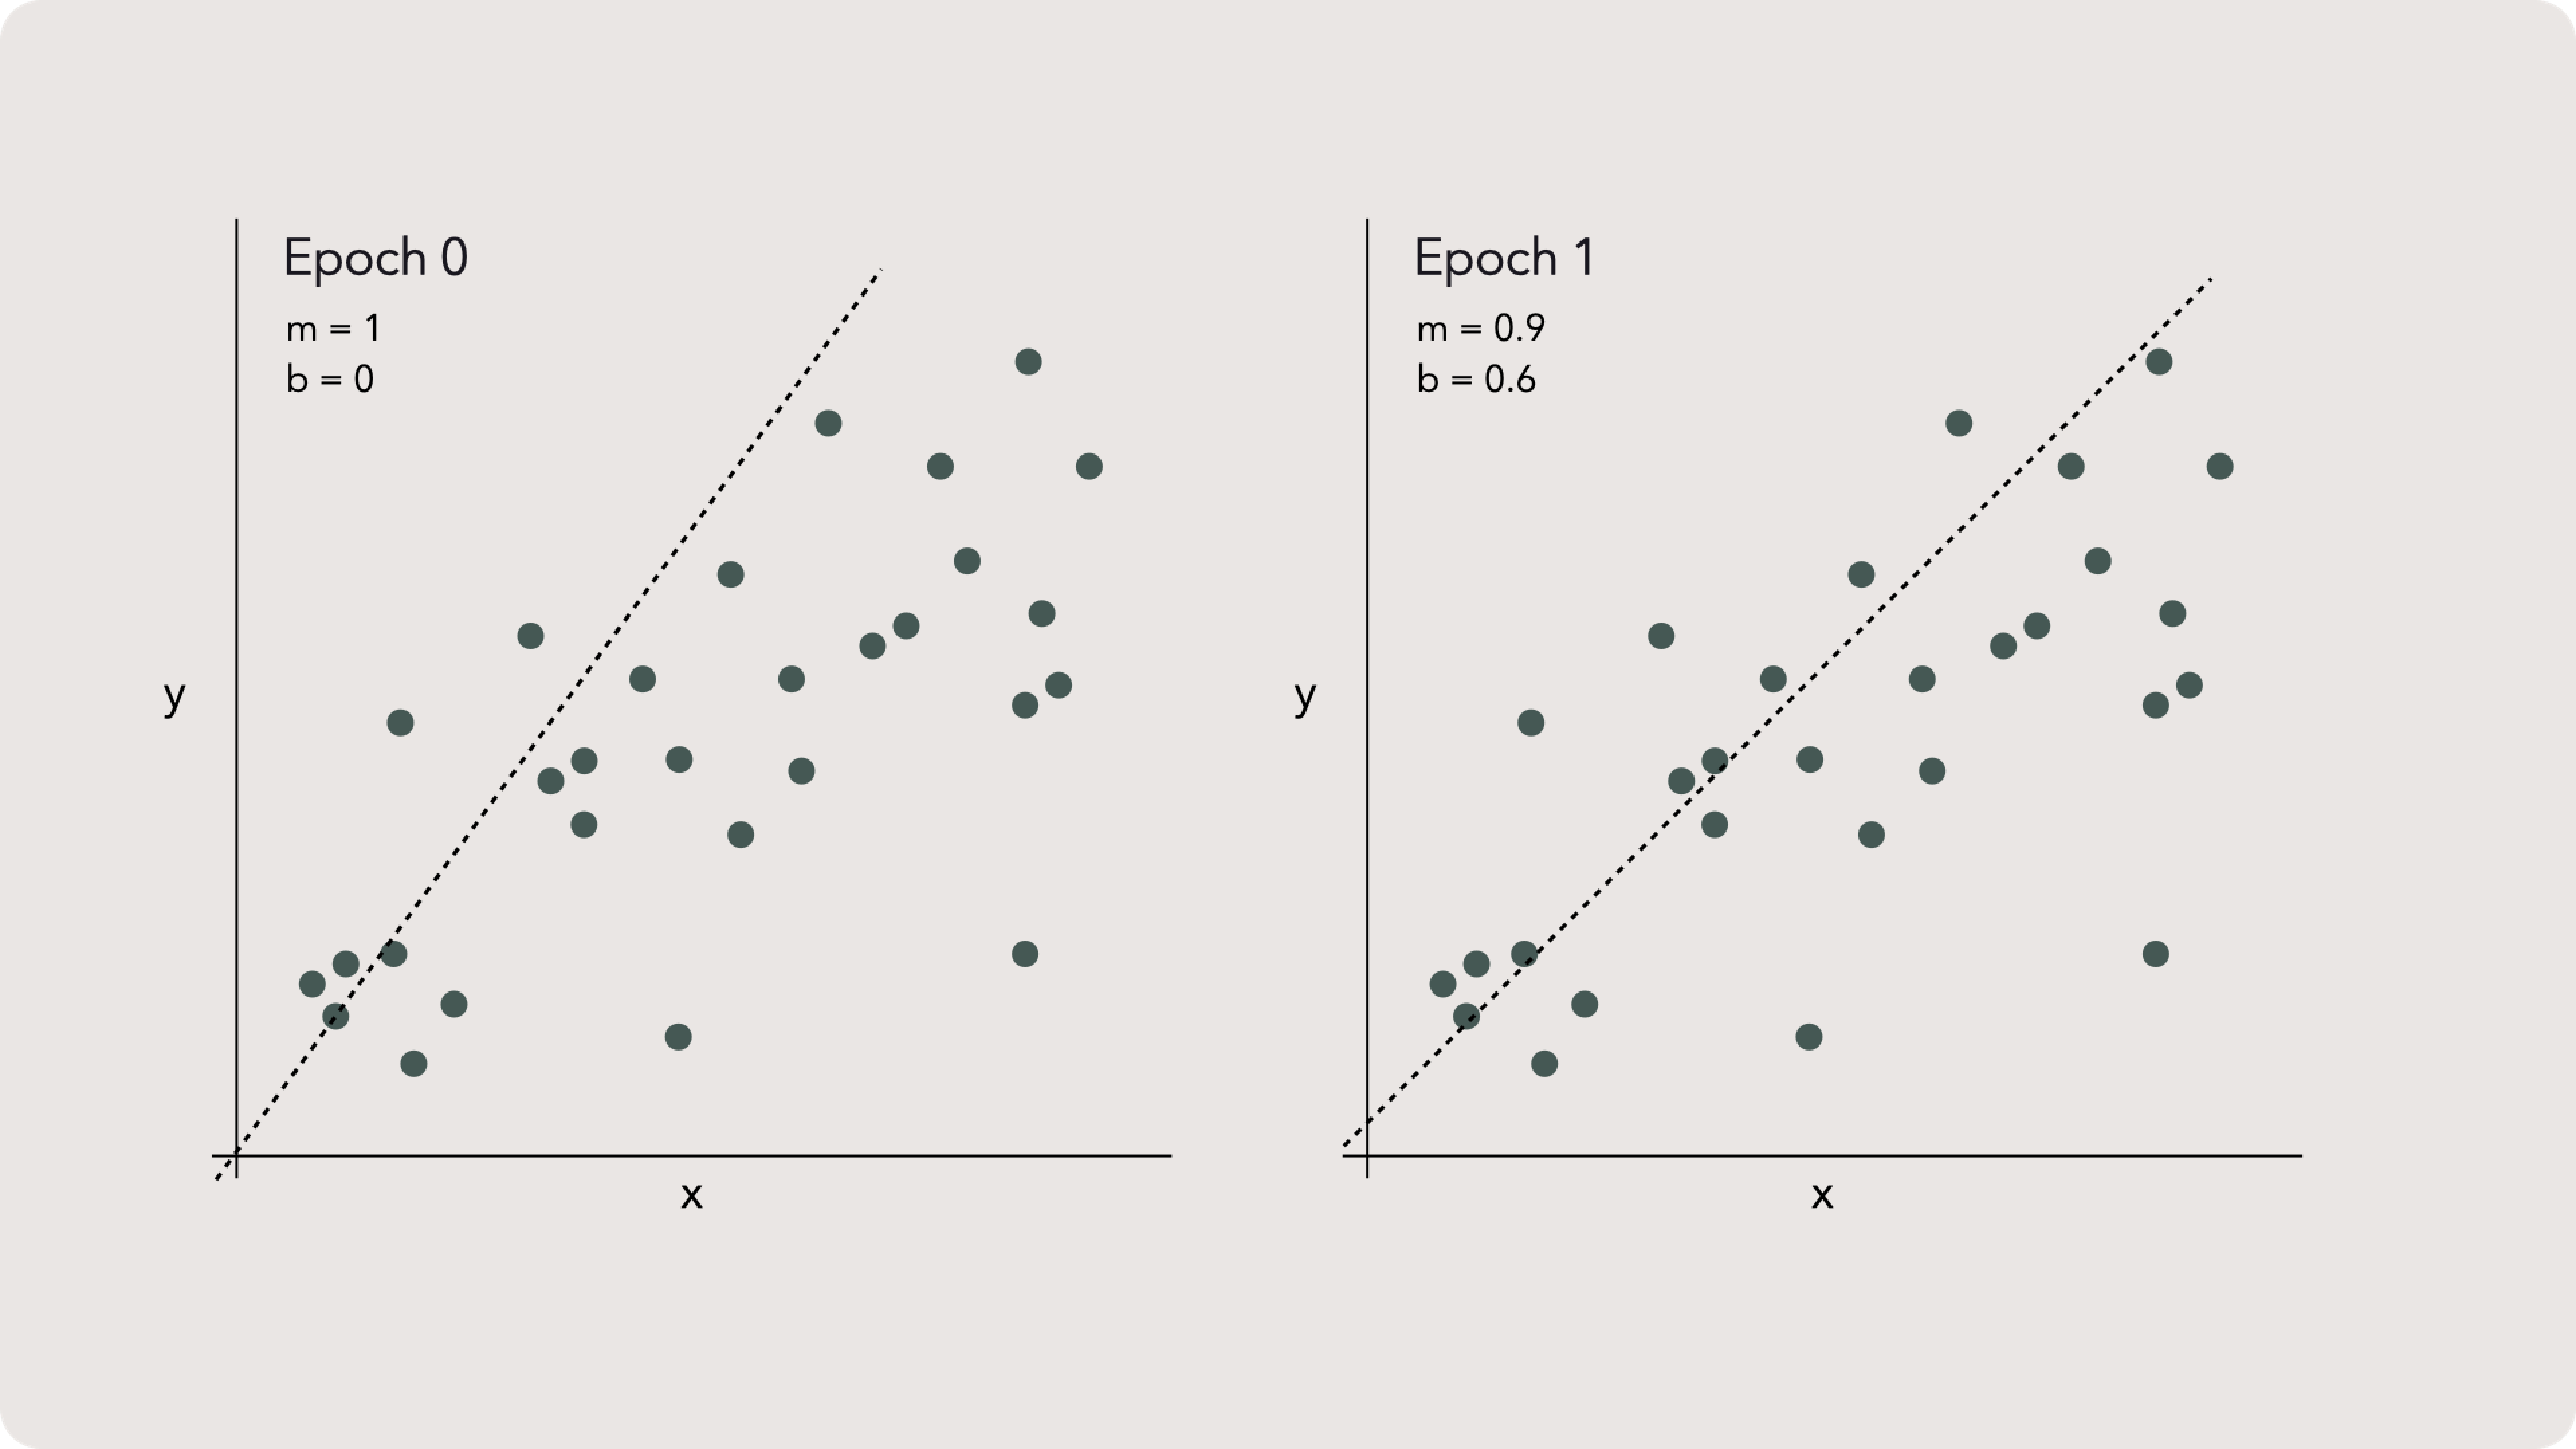
The process is pretty straightforward. We start with some value for our parameters, m and b and call this epoch 0. You could also call this a generation or iteration, but data scientists call it an epoch. Thats probably because it sounds way cooler.
After creating the line for epoch 0, we calculate the RSME and record it. Then we update the parameters to create a new epoch, 1, and repeat the process.
... More Epochs
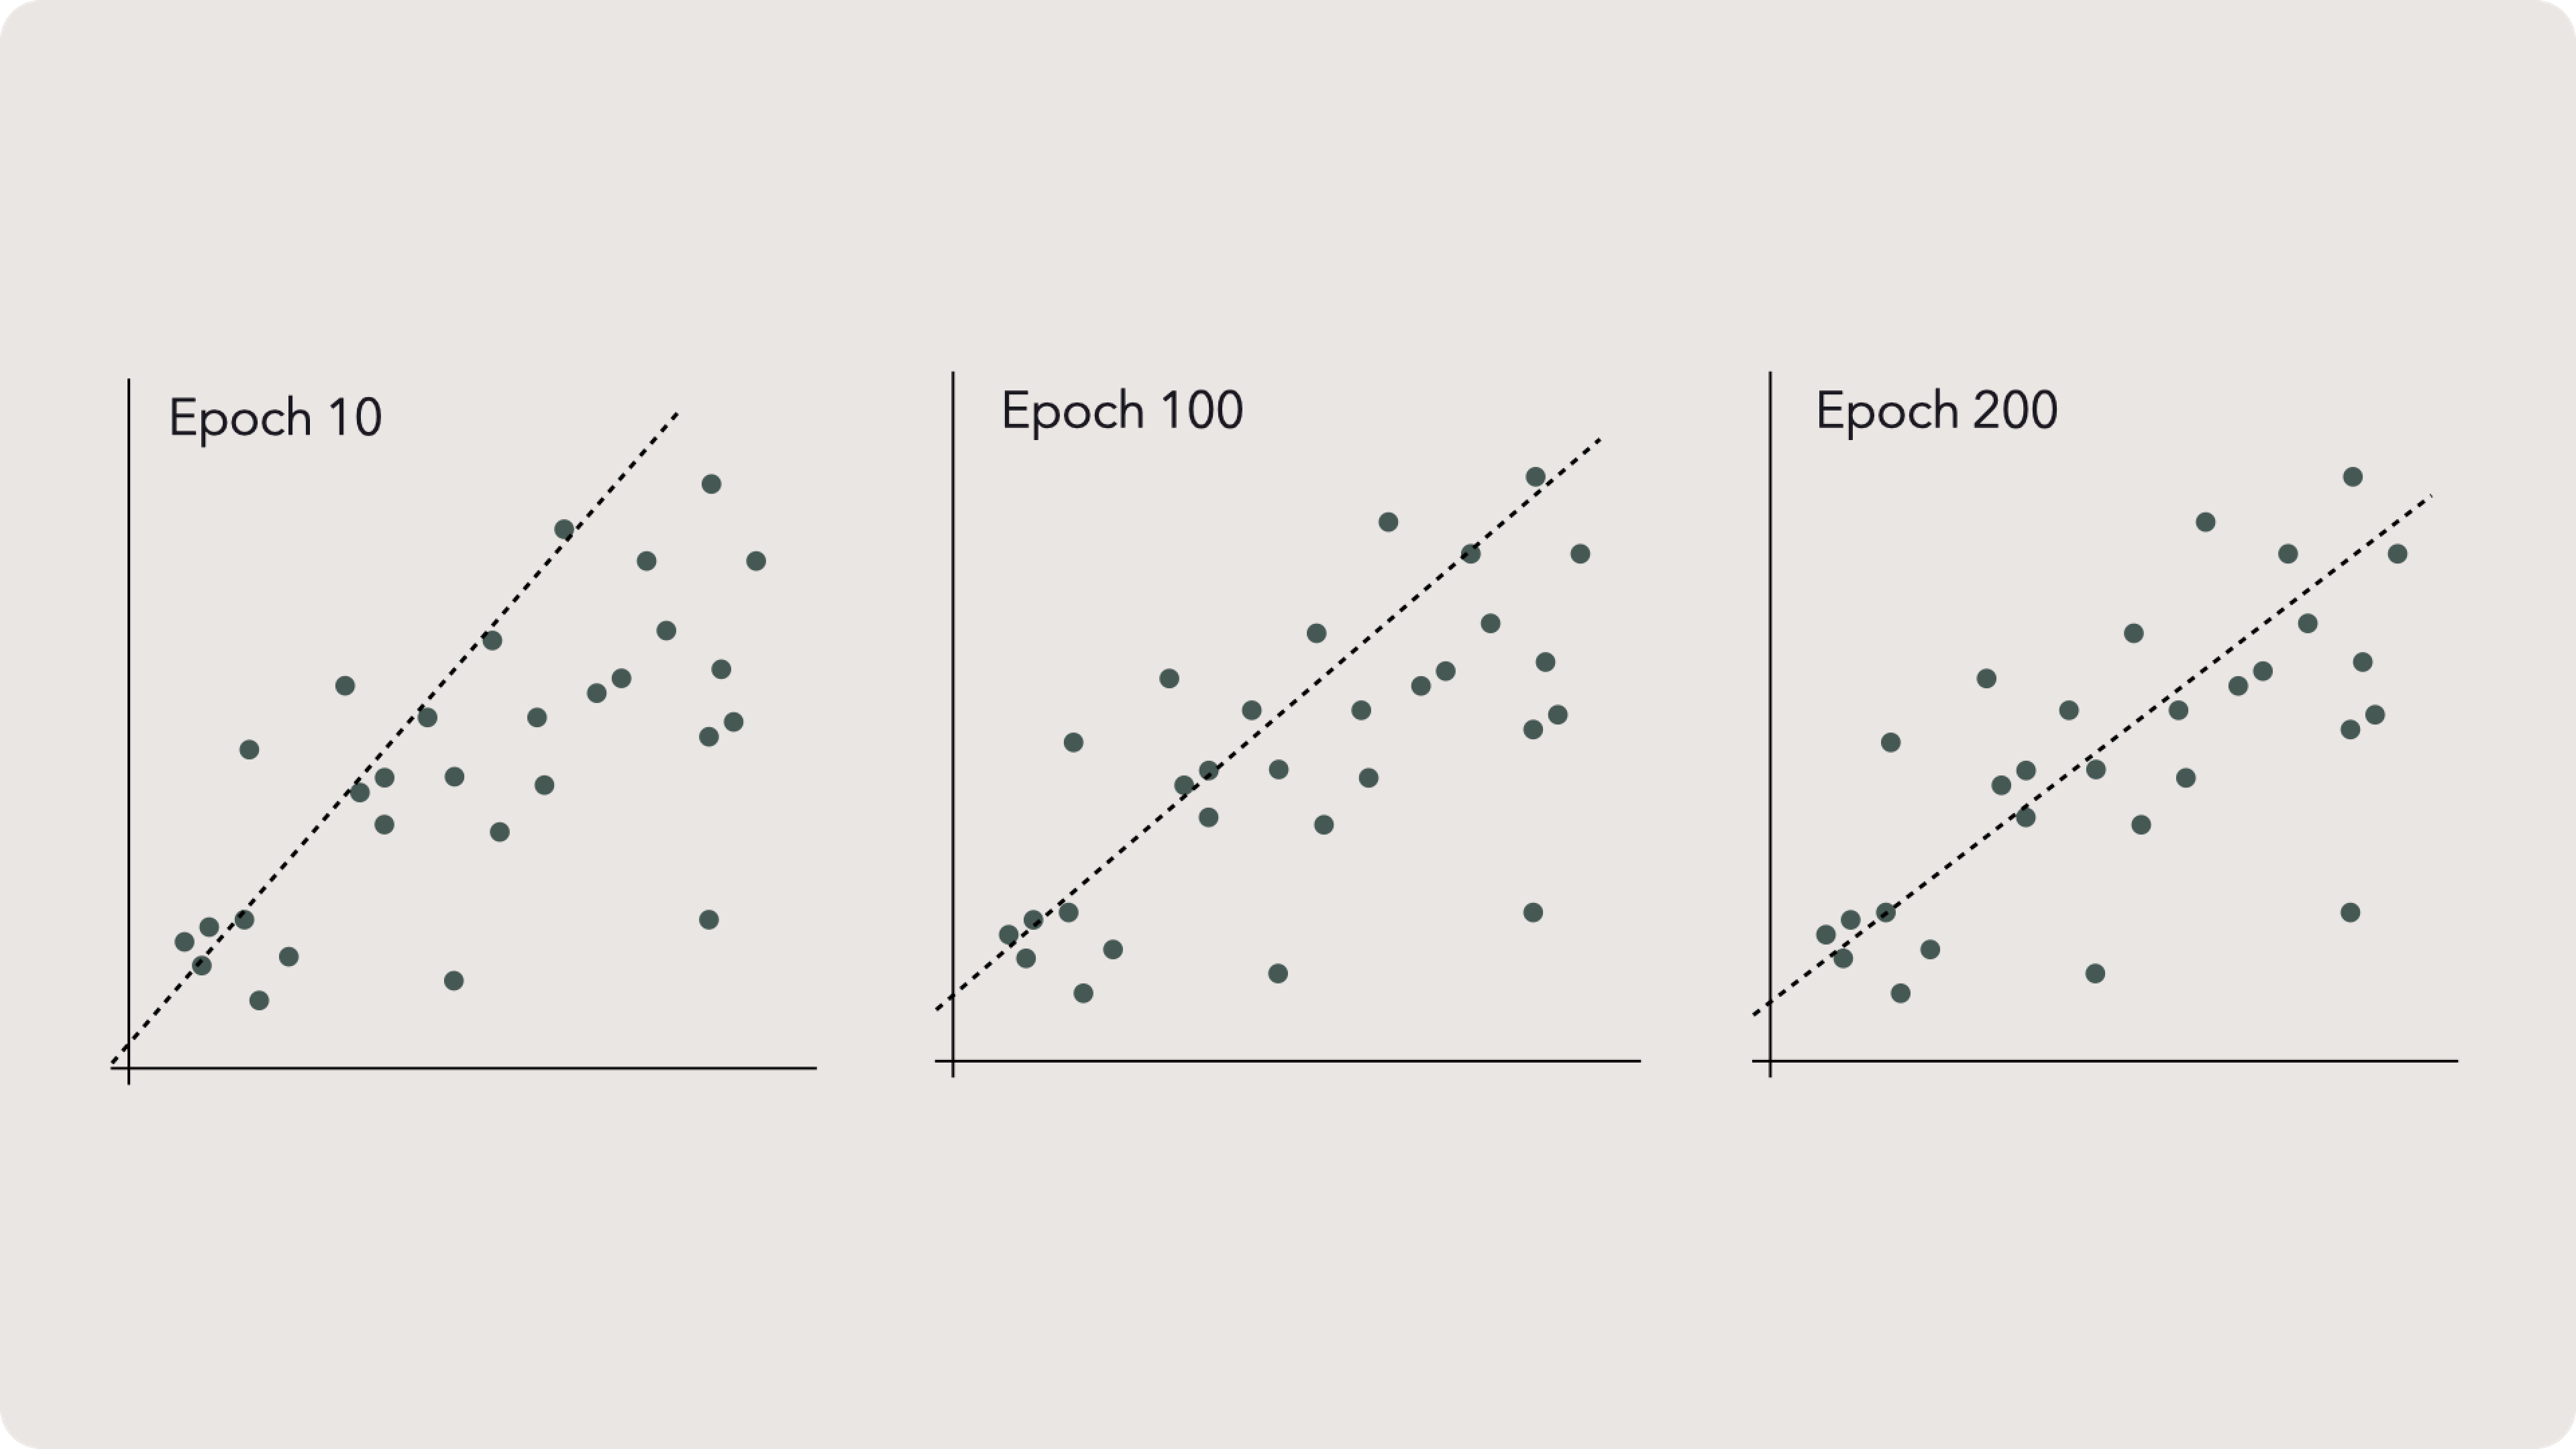
Gradient descent iterations
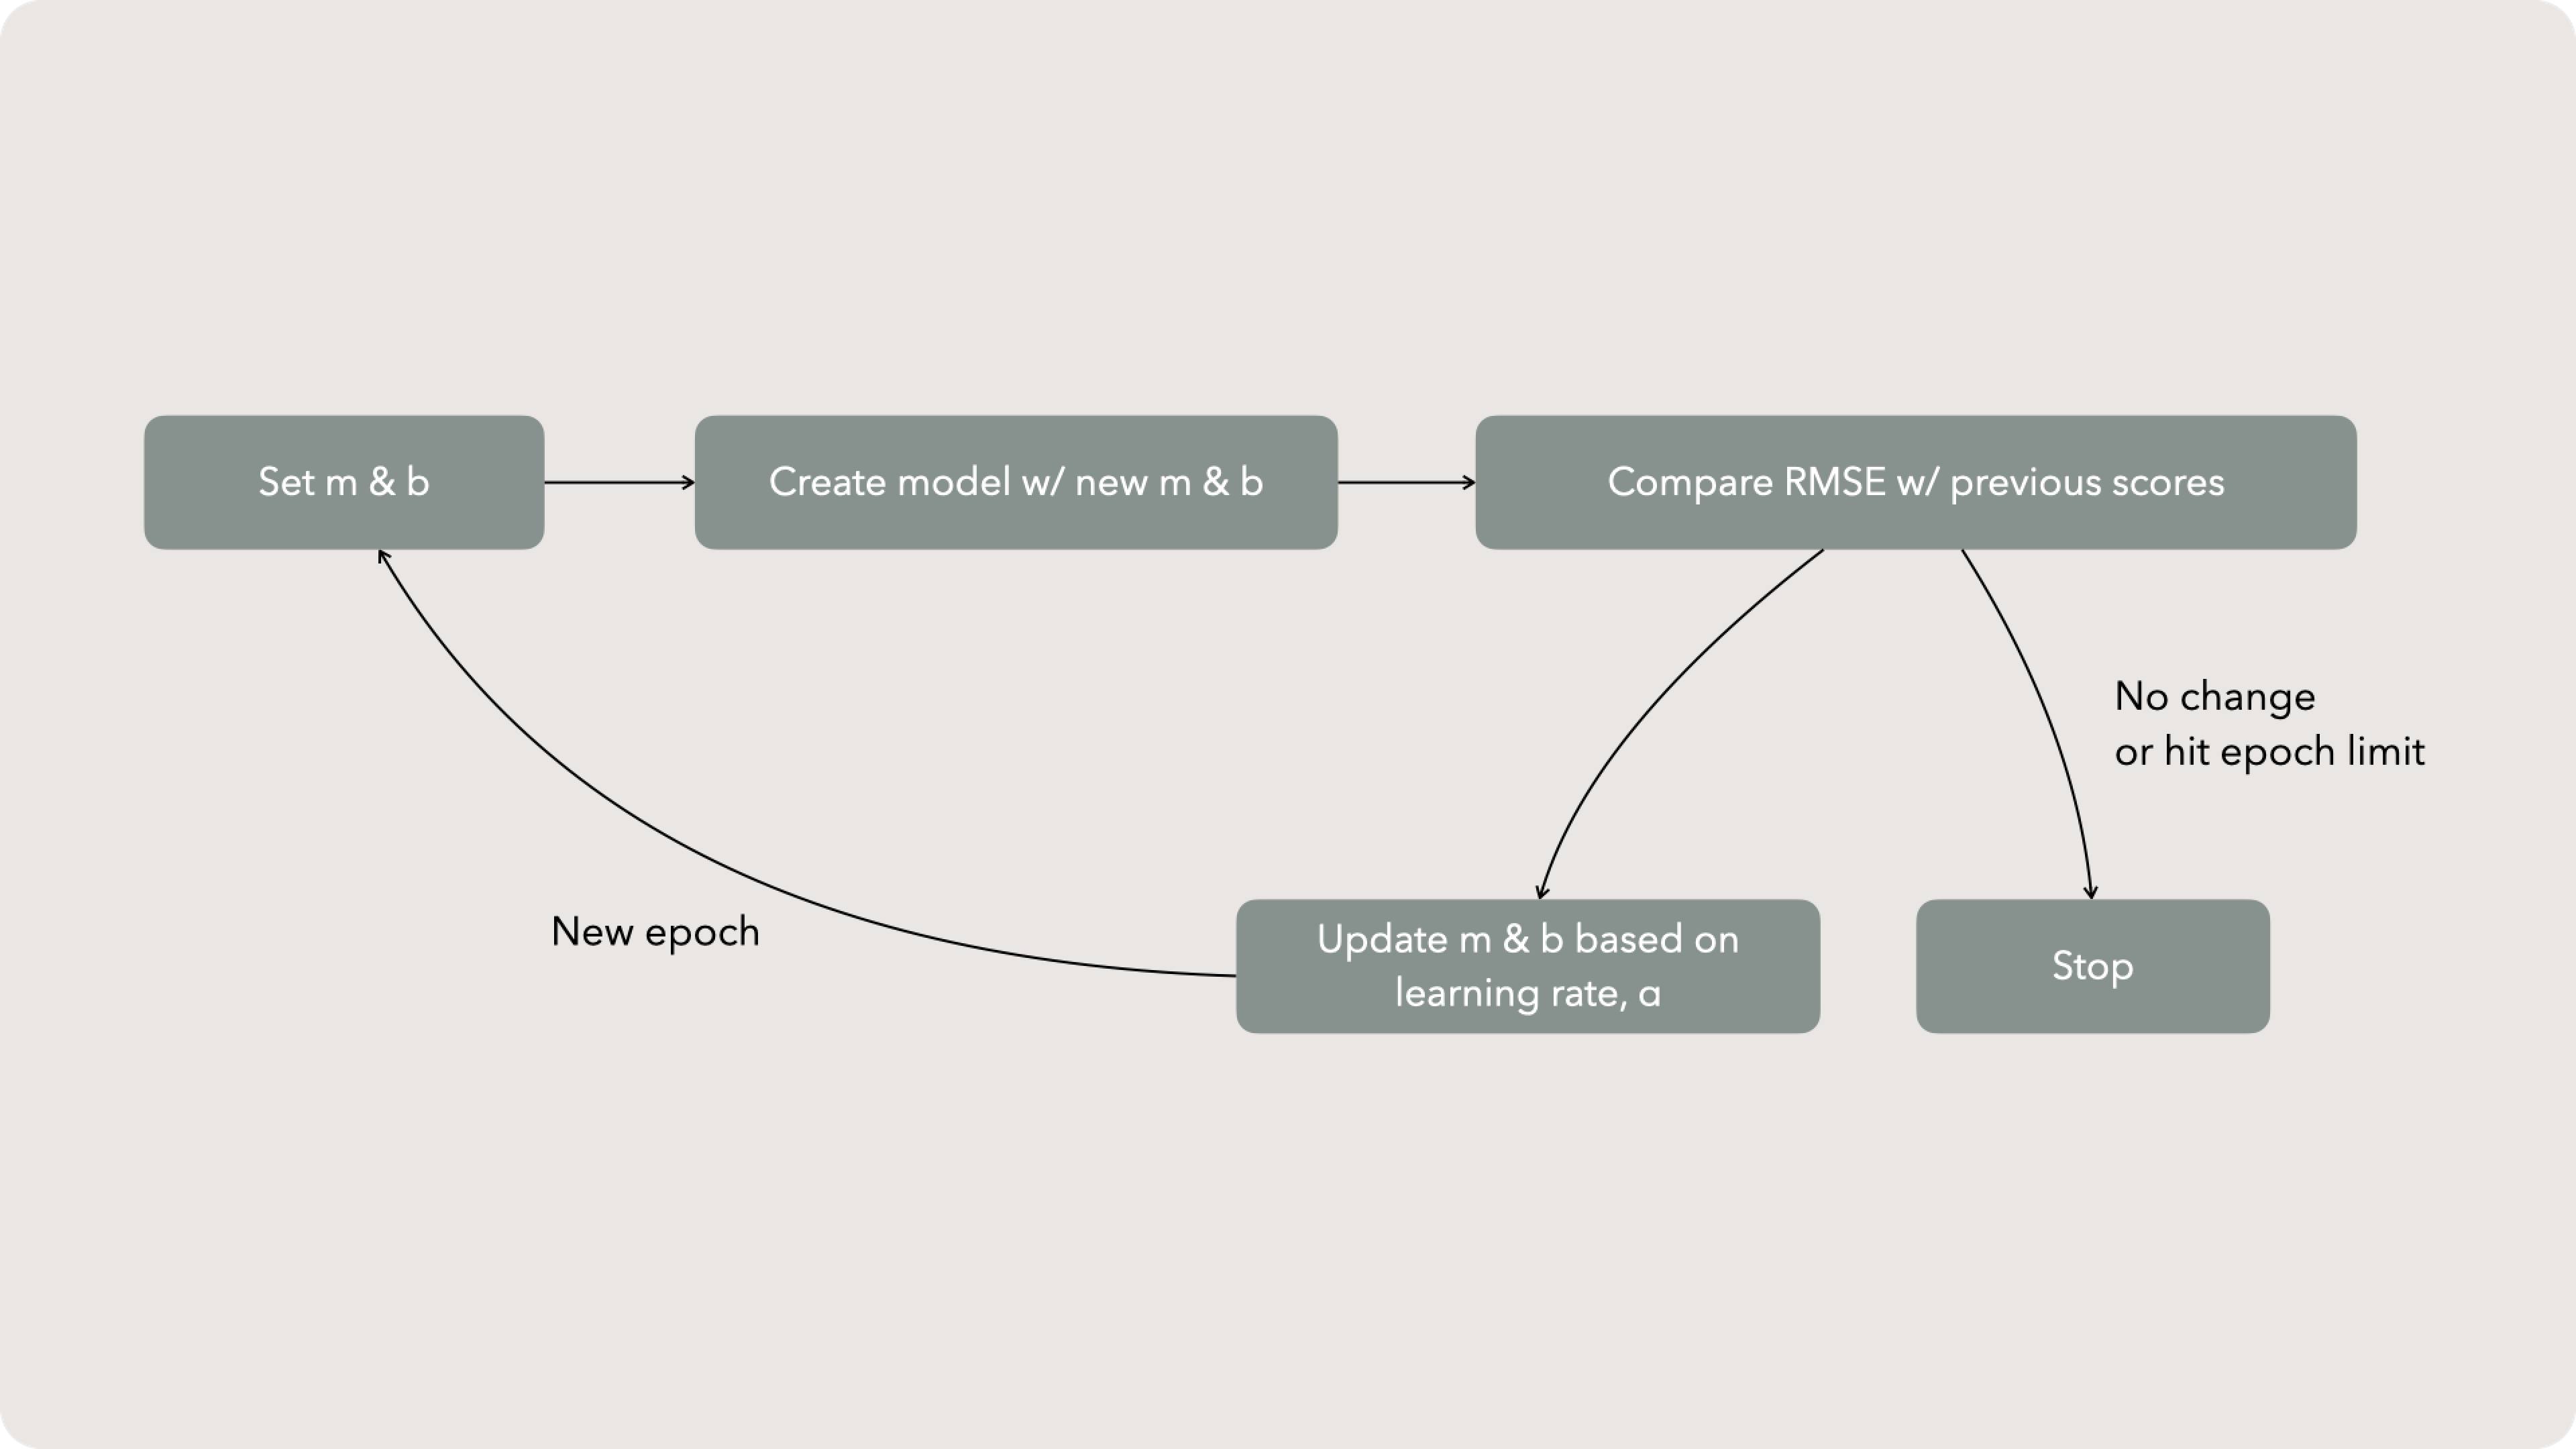
Updating m & b
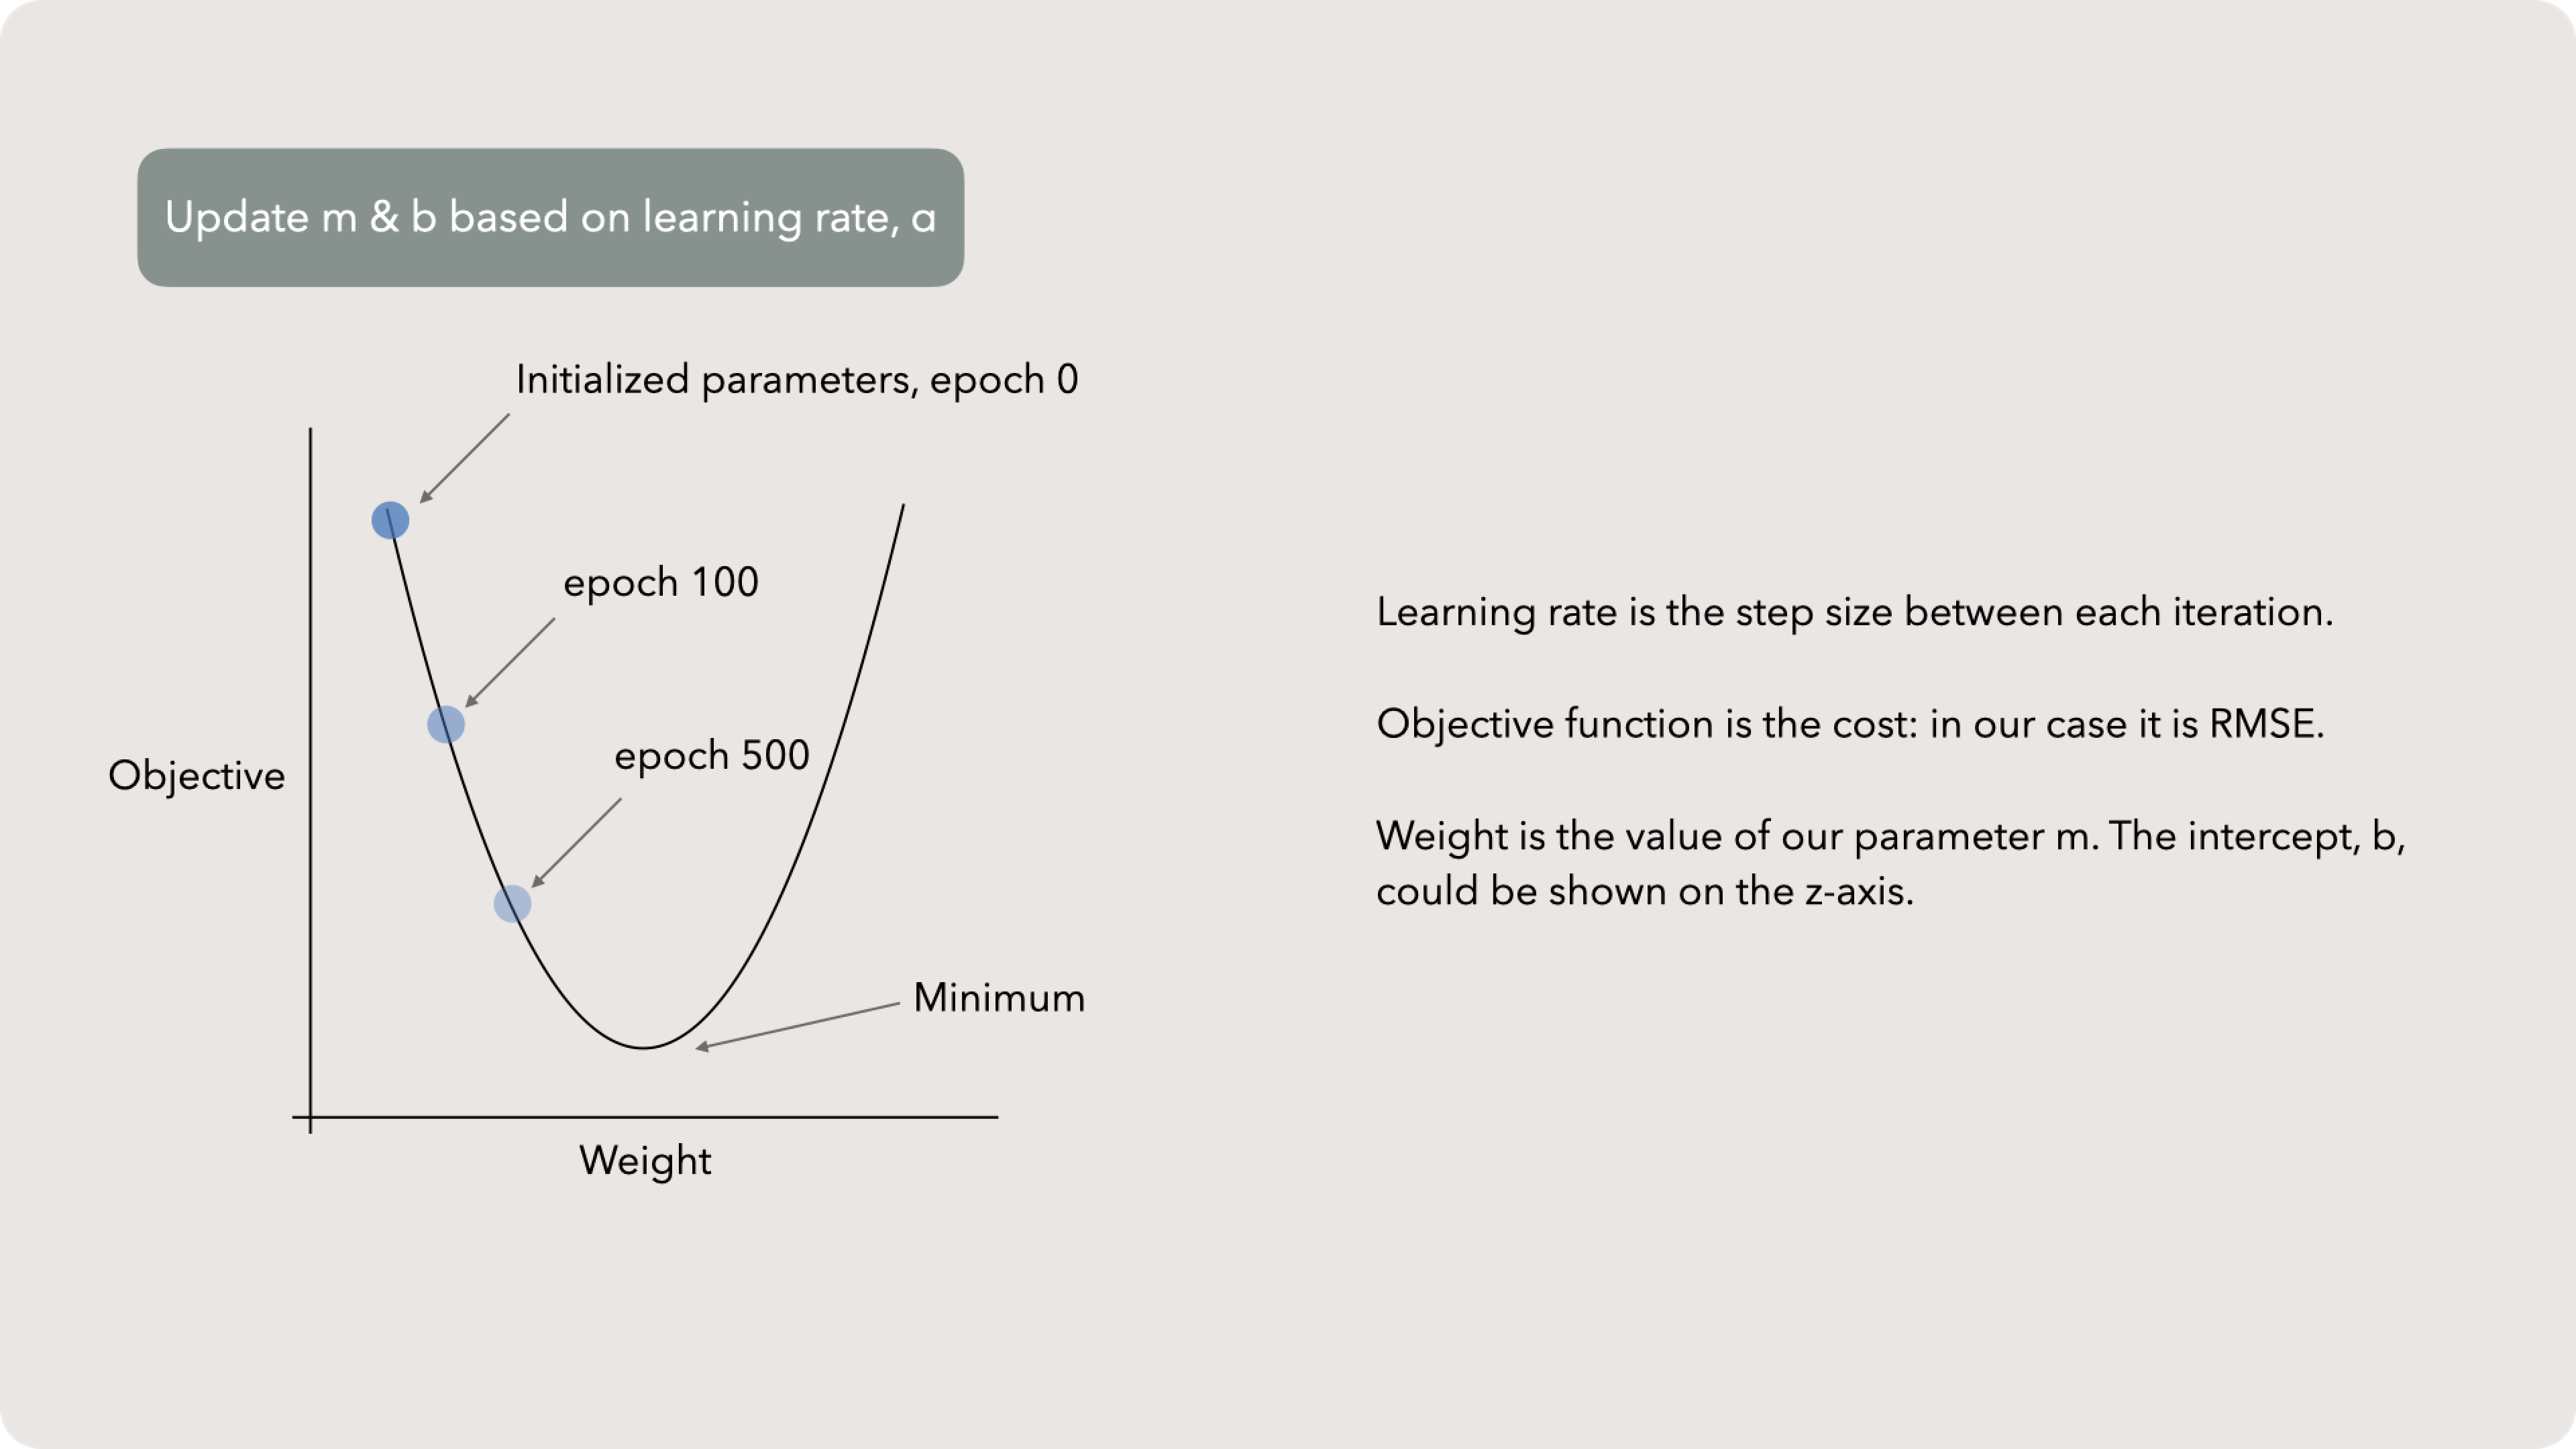
Learning rate
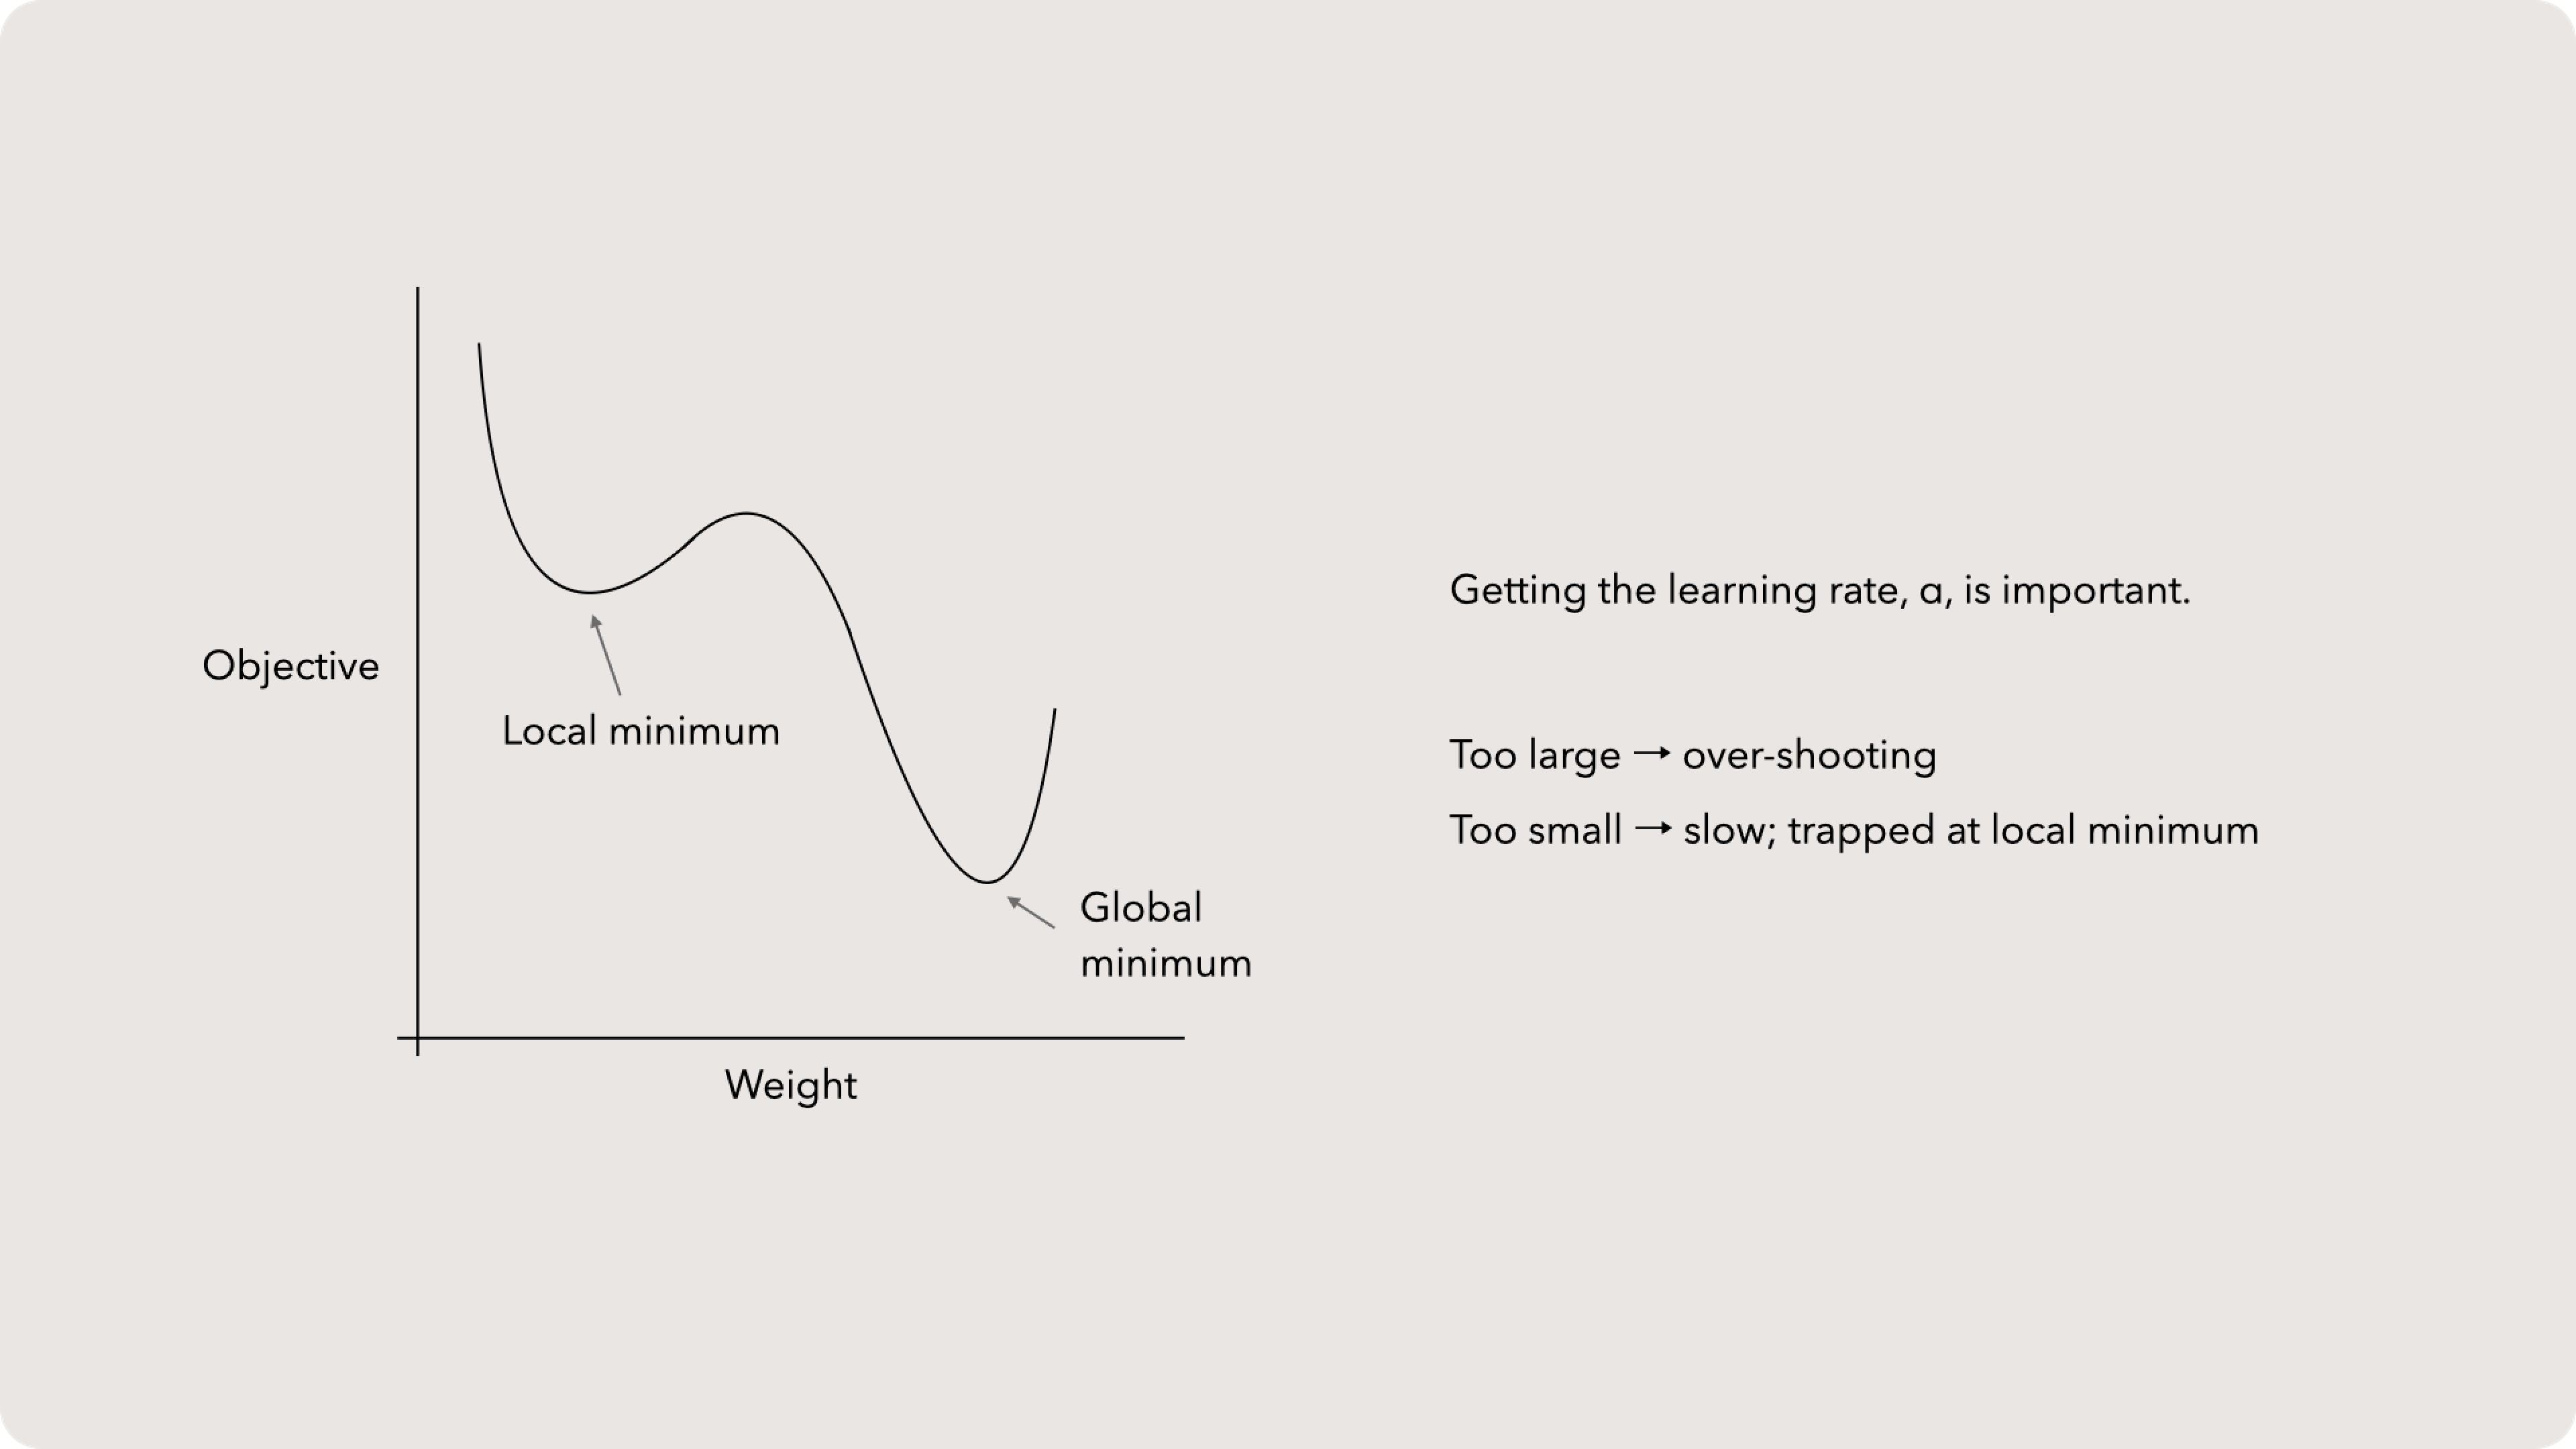
The intuition behind selecting a learning rate approach is that we need to get things ‘just right’. Too large of a rate change and we risk overshooting our global minimum. If we select too small of a learning rate, we might be trapped in a local minimum and unable to climb past a nearby hill. Fortunately, most tools have quick and dirty ways to find an appropriate learning rate.
Model components
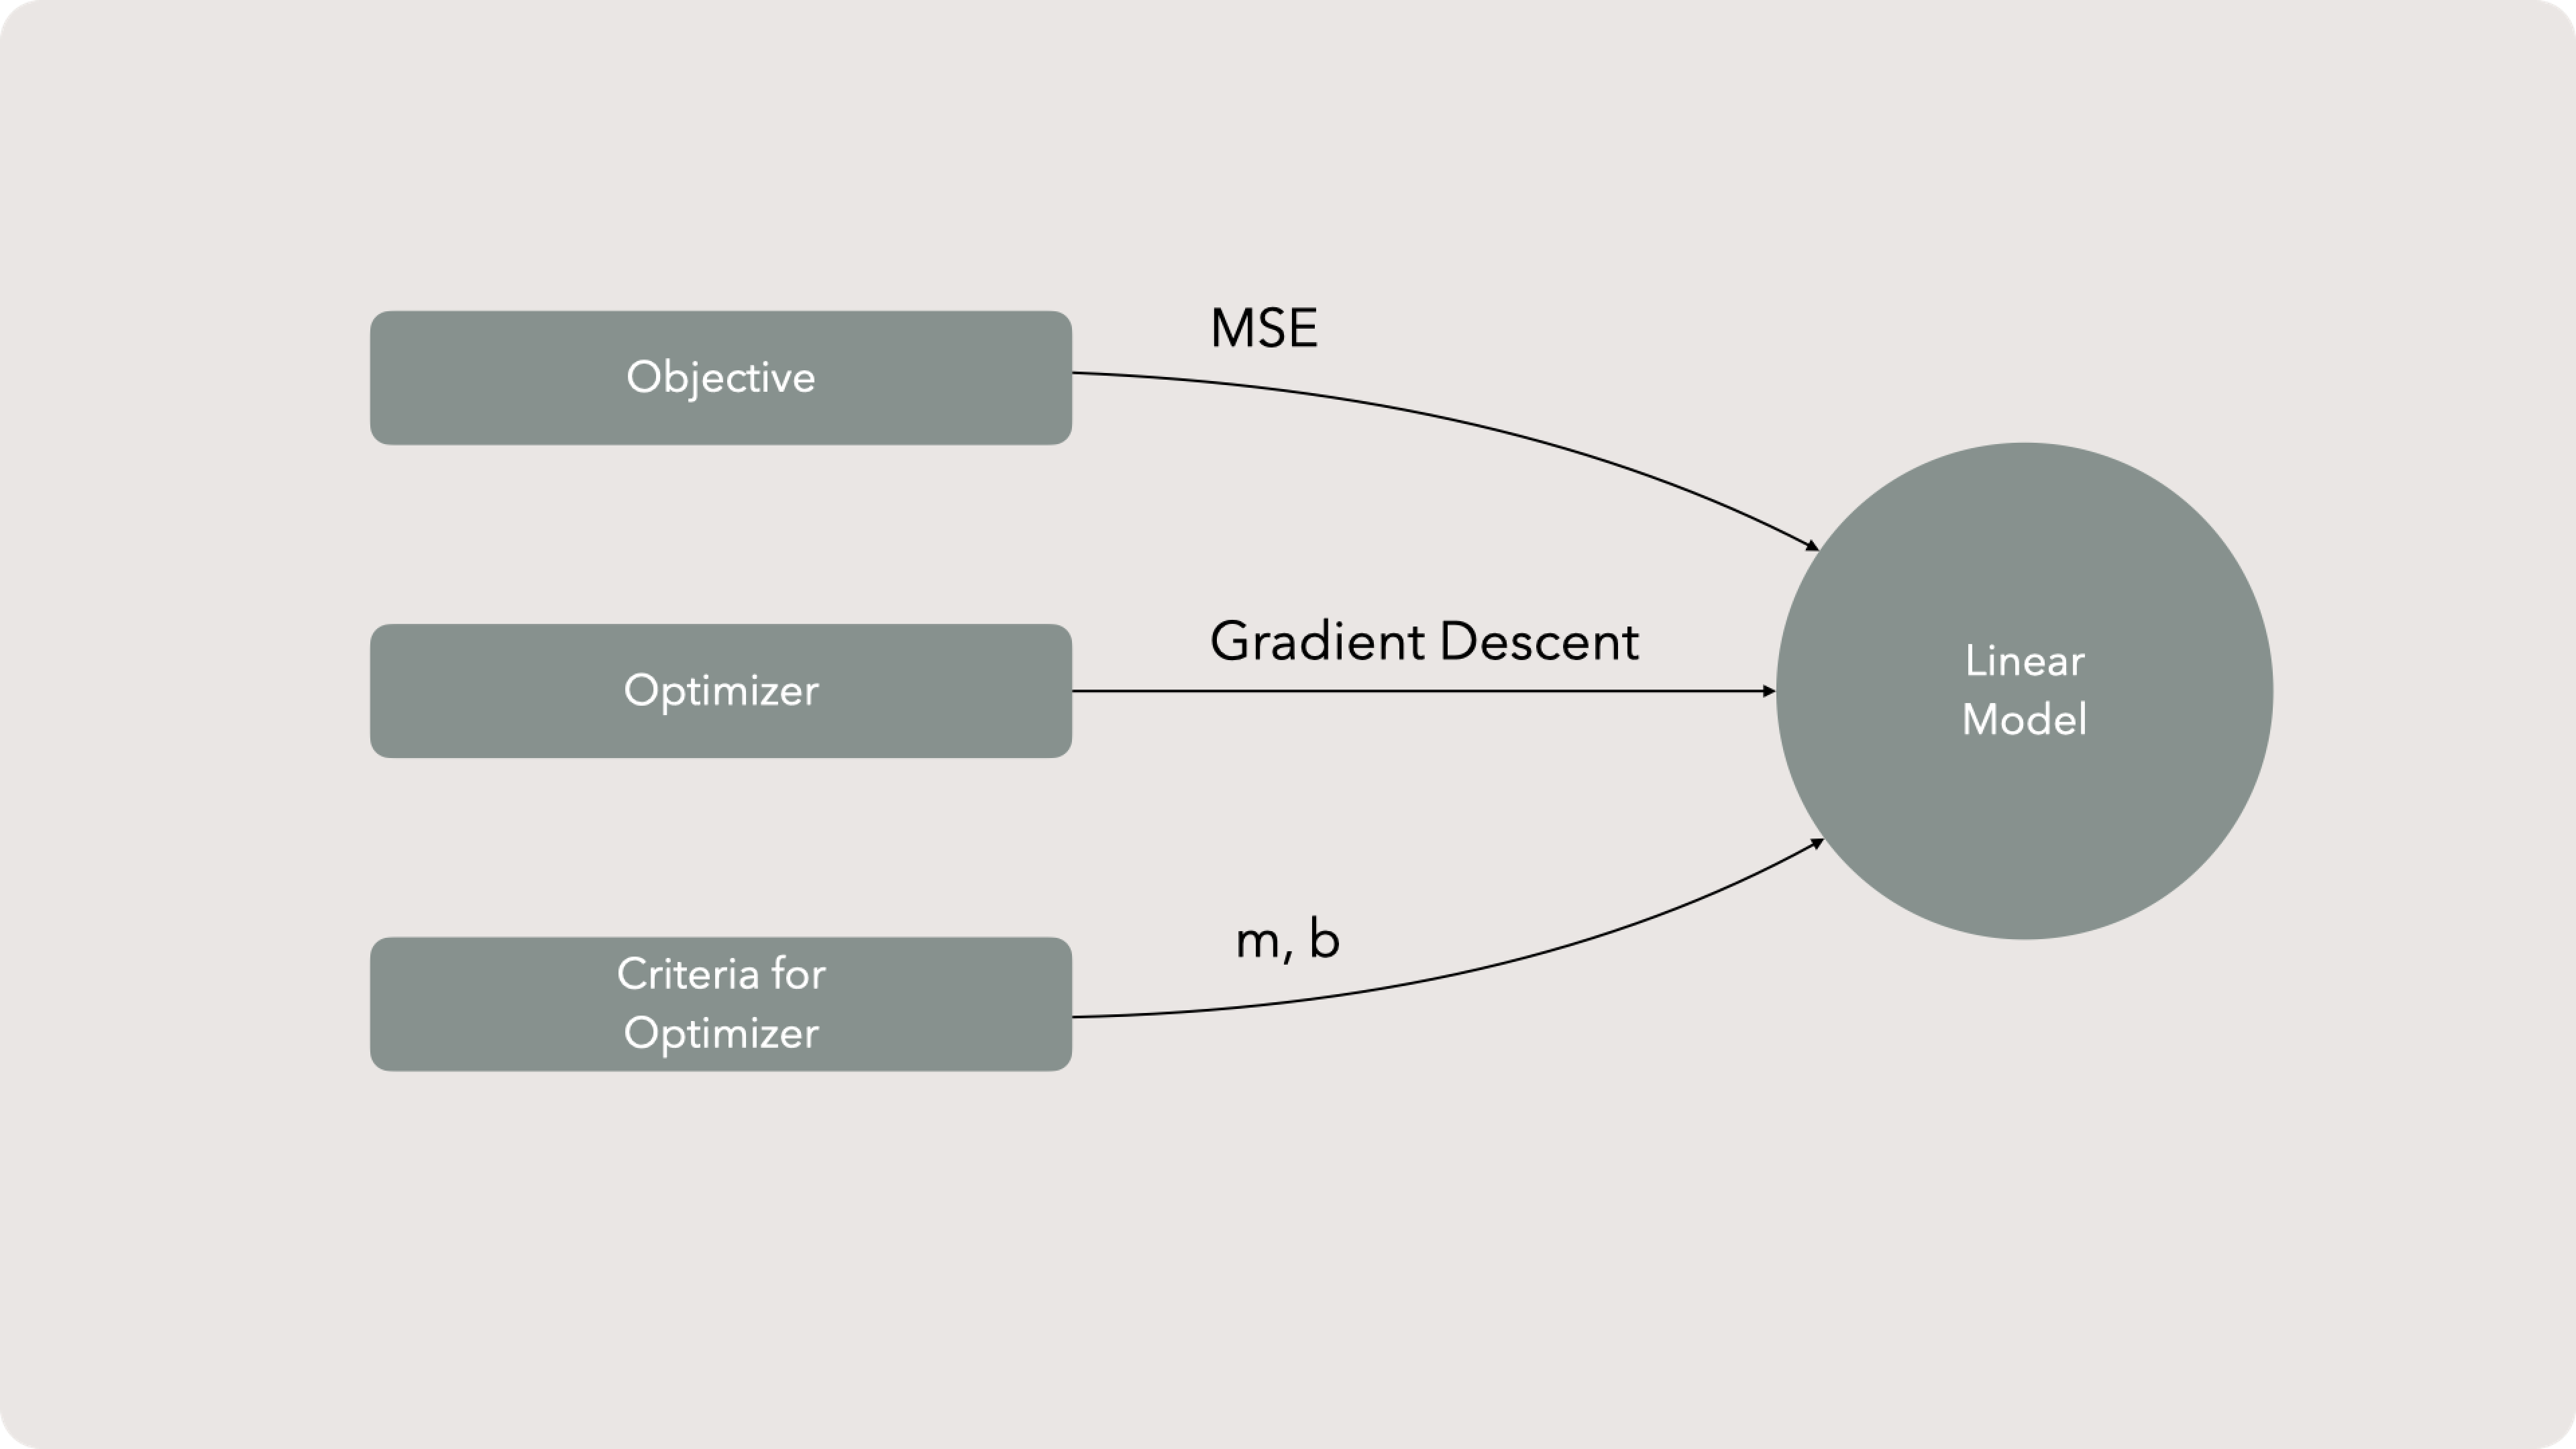
One key note: we have been talking about selecting the parameters to fit a line to data. This assumes that our independent variable is the correct variable and we shouldn’t sub it out, select more or even choose a different approach entirely.
There is another approach to selecting the overall model. The process of Model Selection navigates generalization with predictive power, it isn’t simply about finding the best fit given a feature and a couple of parameters.
Linear Regression Recap
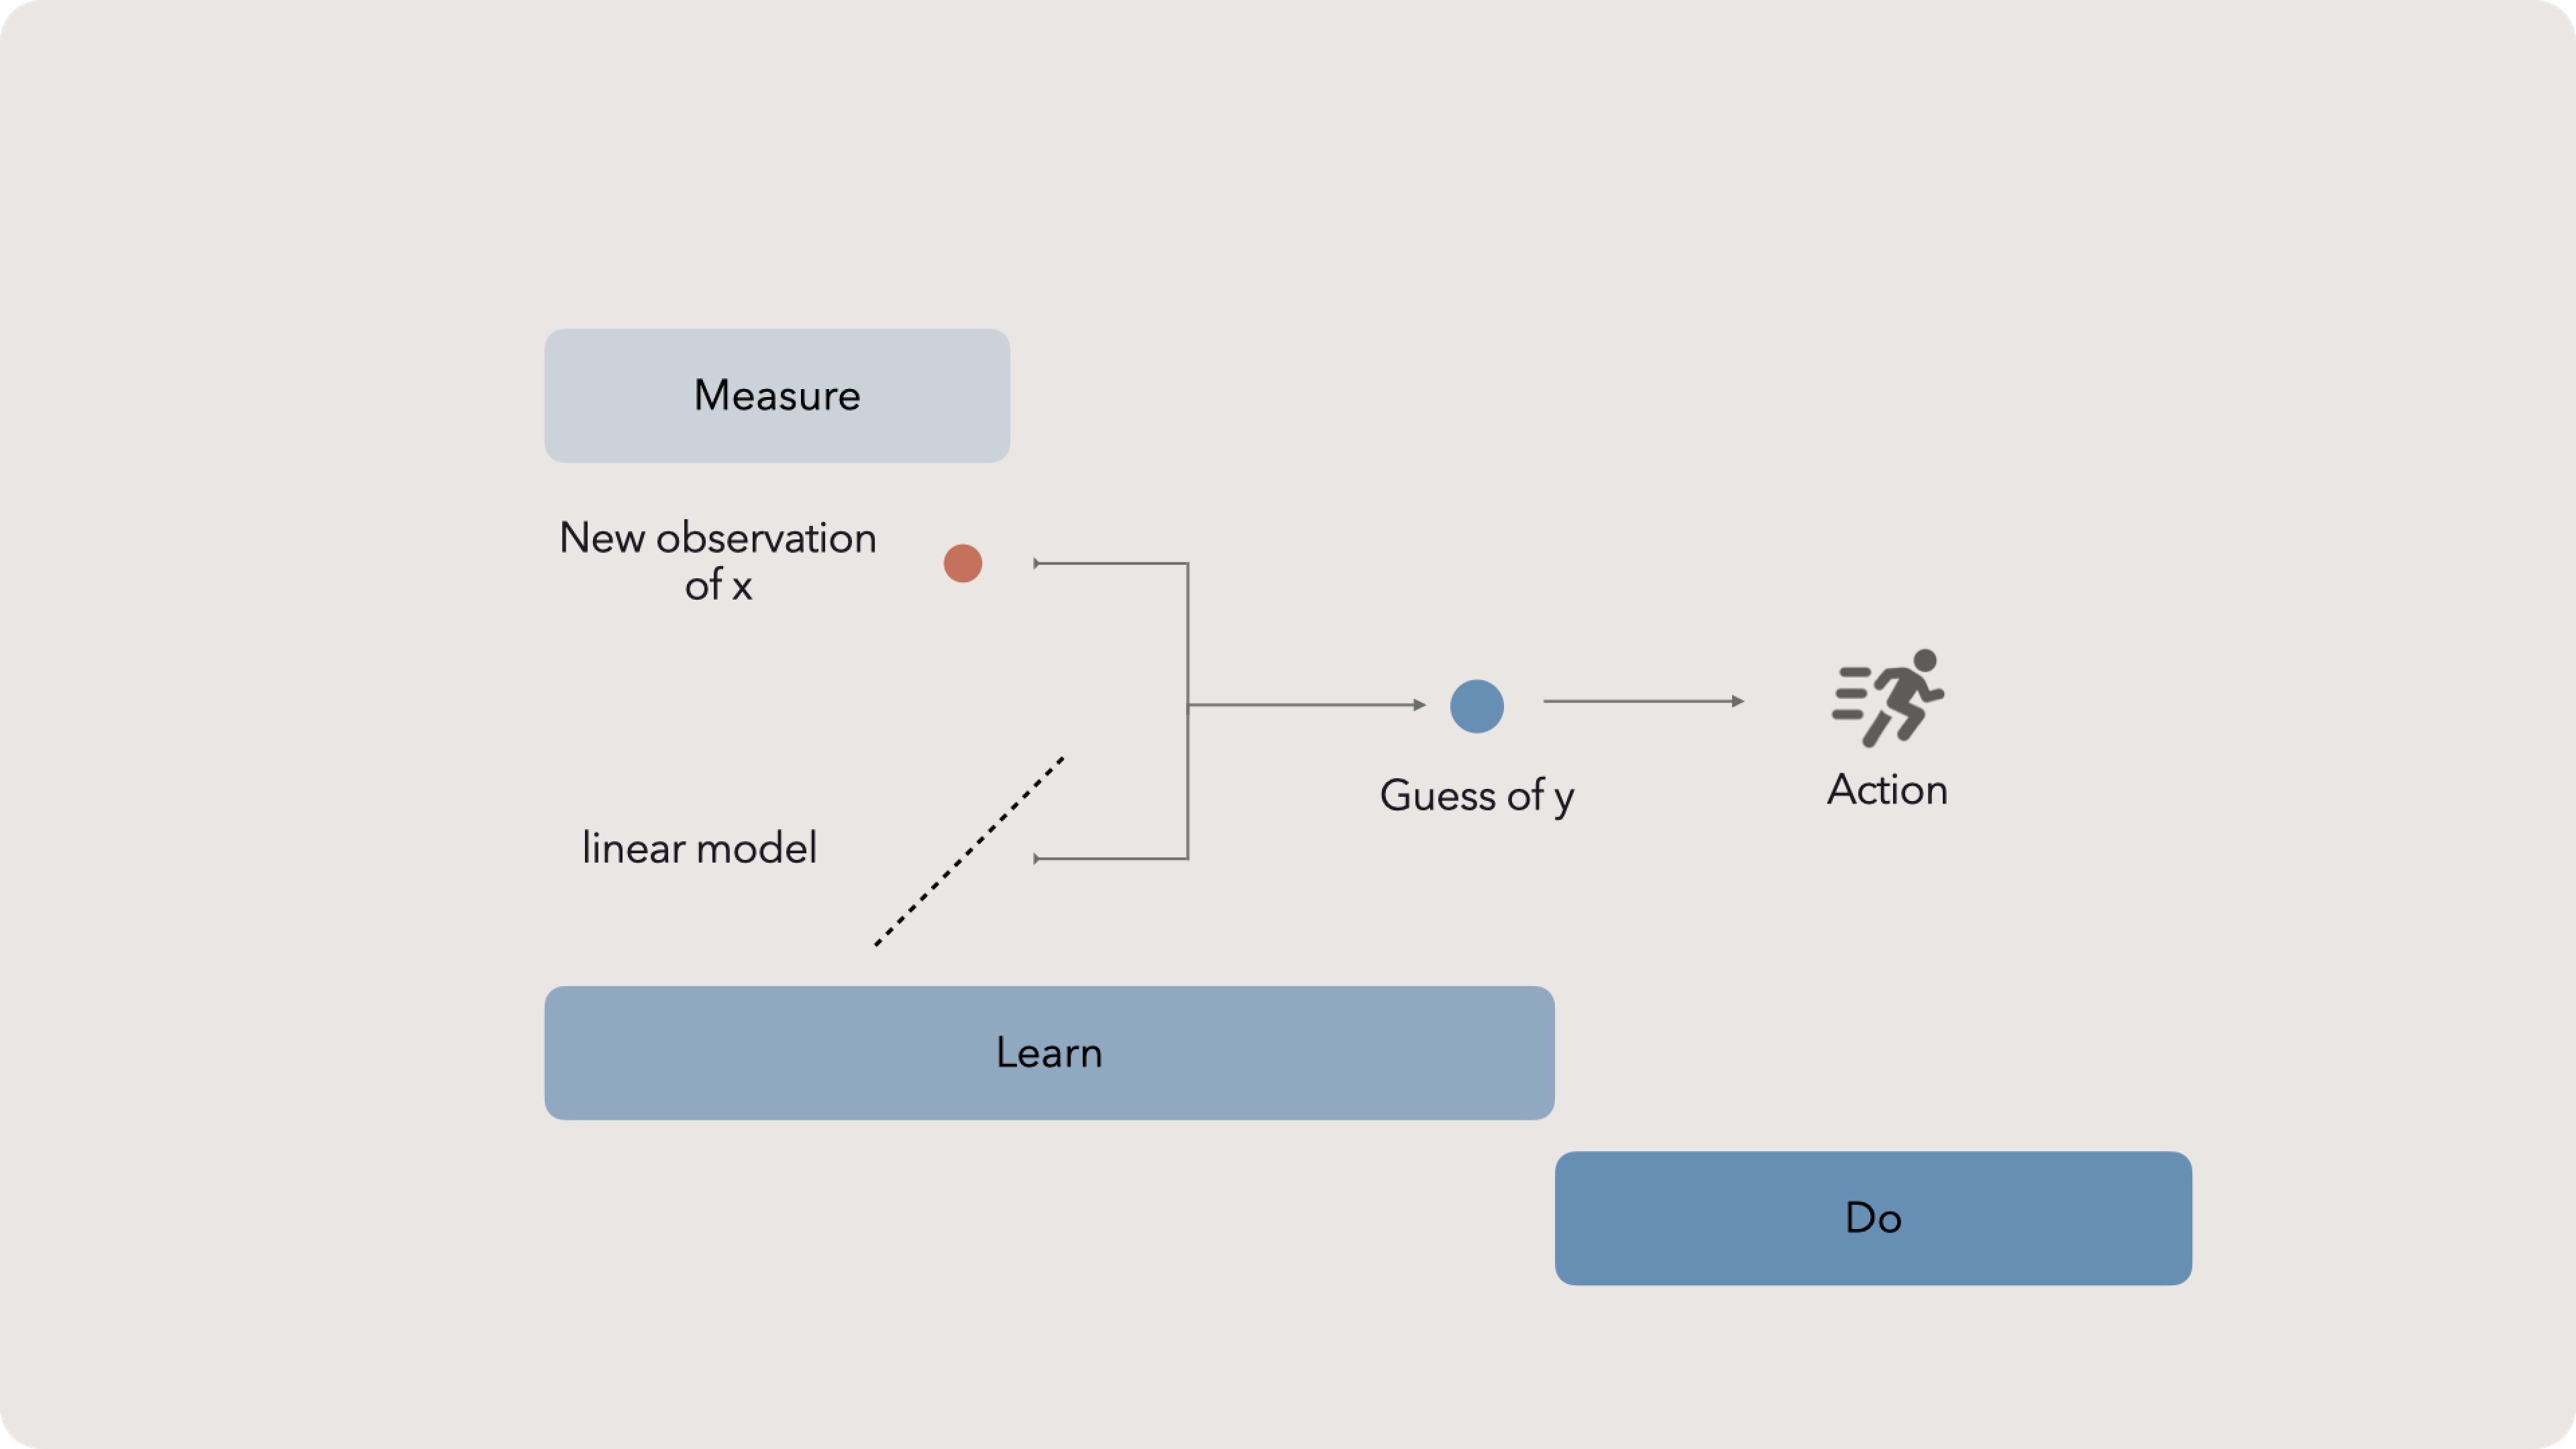
With our model, new observations of x can predict unobserved y values. If our model is generalizable (see prepping data) and the error is relatively low, action can be taken with just a fraction of the effort. Remember, learning without doing is like home cooking without eating — perhaps fun, but not filling.
Measure Learn Do
