Making good decisions with imperfect data
The title of this series is based on a quote by Stephen Fry — an acclaimed actor, historian, activist and thinker.To quote: “The oxford manner is to play gracefully with ideas.” Meaning, the point of liberal education isn't to learn facts but to acquire the skill of gently rolling ideas around in your own head. These ideas may be wrong, right, vague exact, vulgar or obscene. We toy with these thoughts and bounce them around in our heads to test them. To do this well, we must train our brains to hold seemingly contradictory or even false thoughts in our head Practicing this skill liberates us.
To that end, this series is about the intersection between data science and graceful thinking. This course won't just discuss how we use data science to learn, but also shape a mental framework for exploring ideas and our own curiosity.
"In a grove"
 Most data practitioners are empiricists — they need evidence and fact to make a decision. This is honorable but hardly easy. We all know that data is messy and deriving the truth is a monumental task.
Let’s step away from data for the moment and just talk about the nature of “evidence.” “In a grove” is one of my favorite short stories and explores this idea. In summary, a samurai is escorting his new wife on a journey. Along the way they cross paths with a bandit. Warning: this 1922 story has some dark themes but is considered a classic of Japanese literature.
A samurai is killed
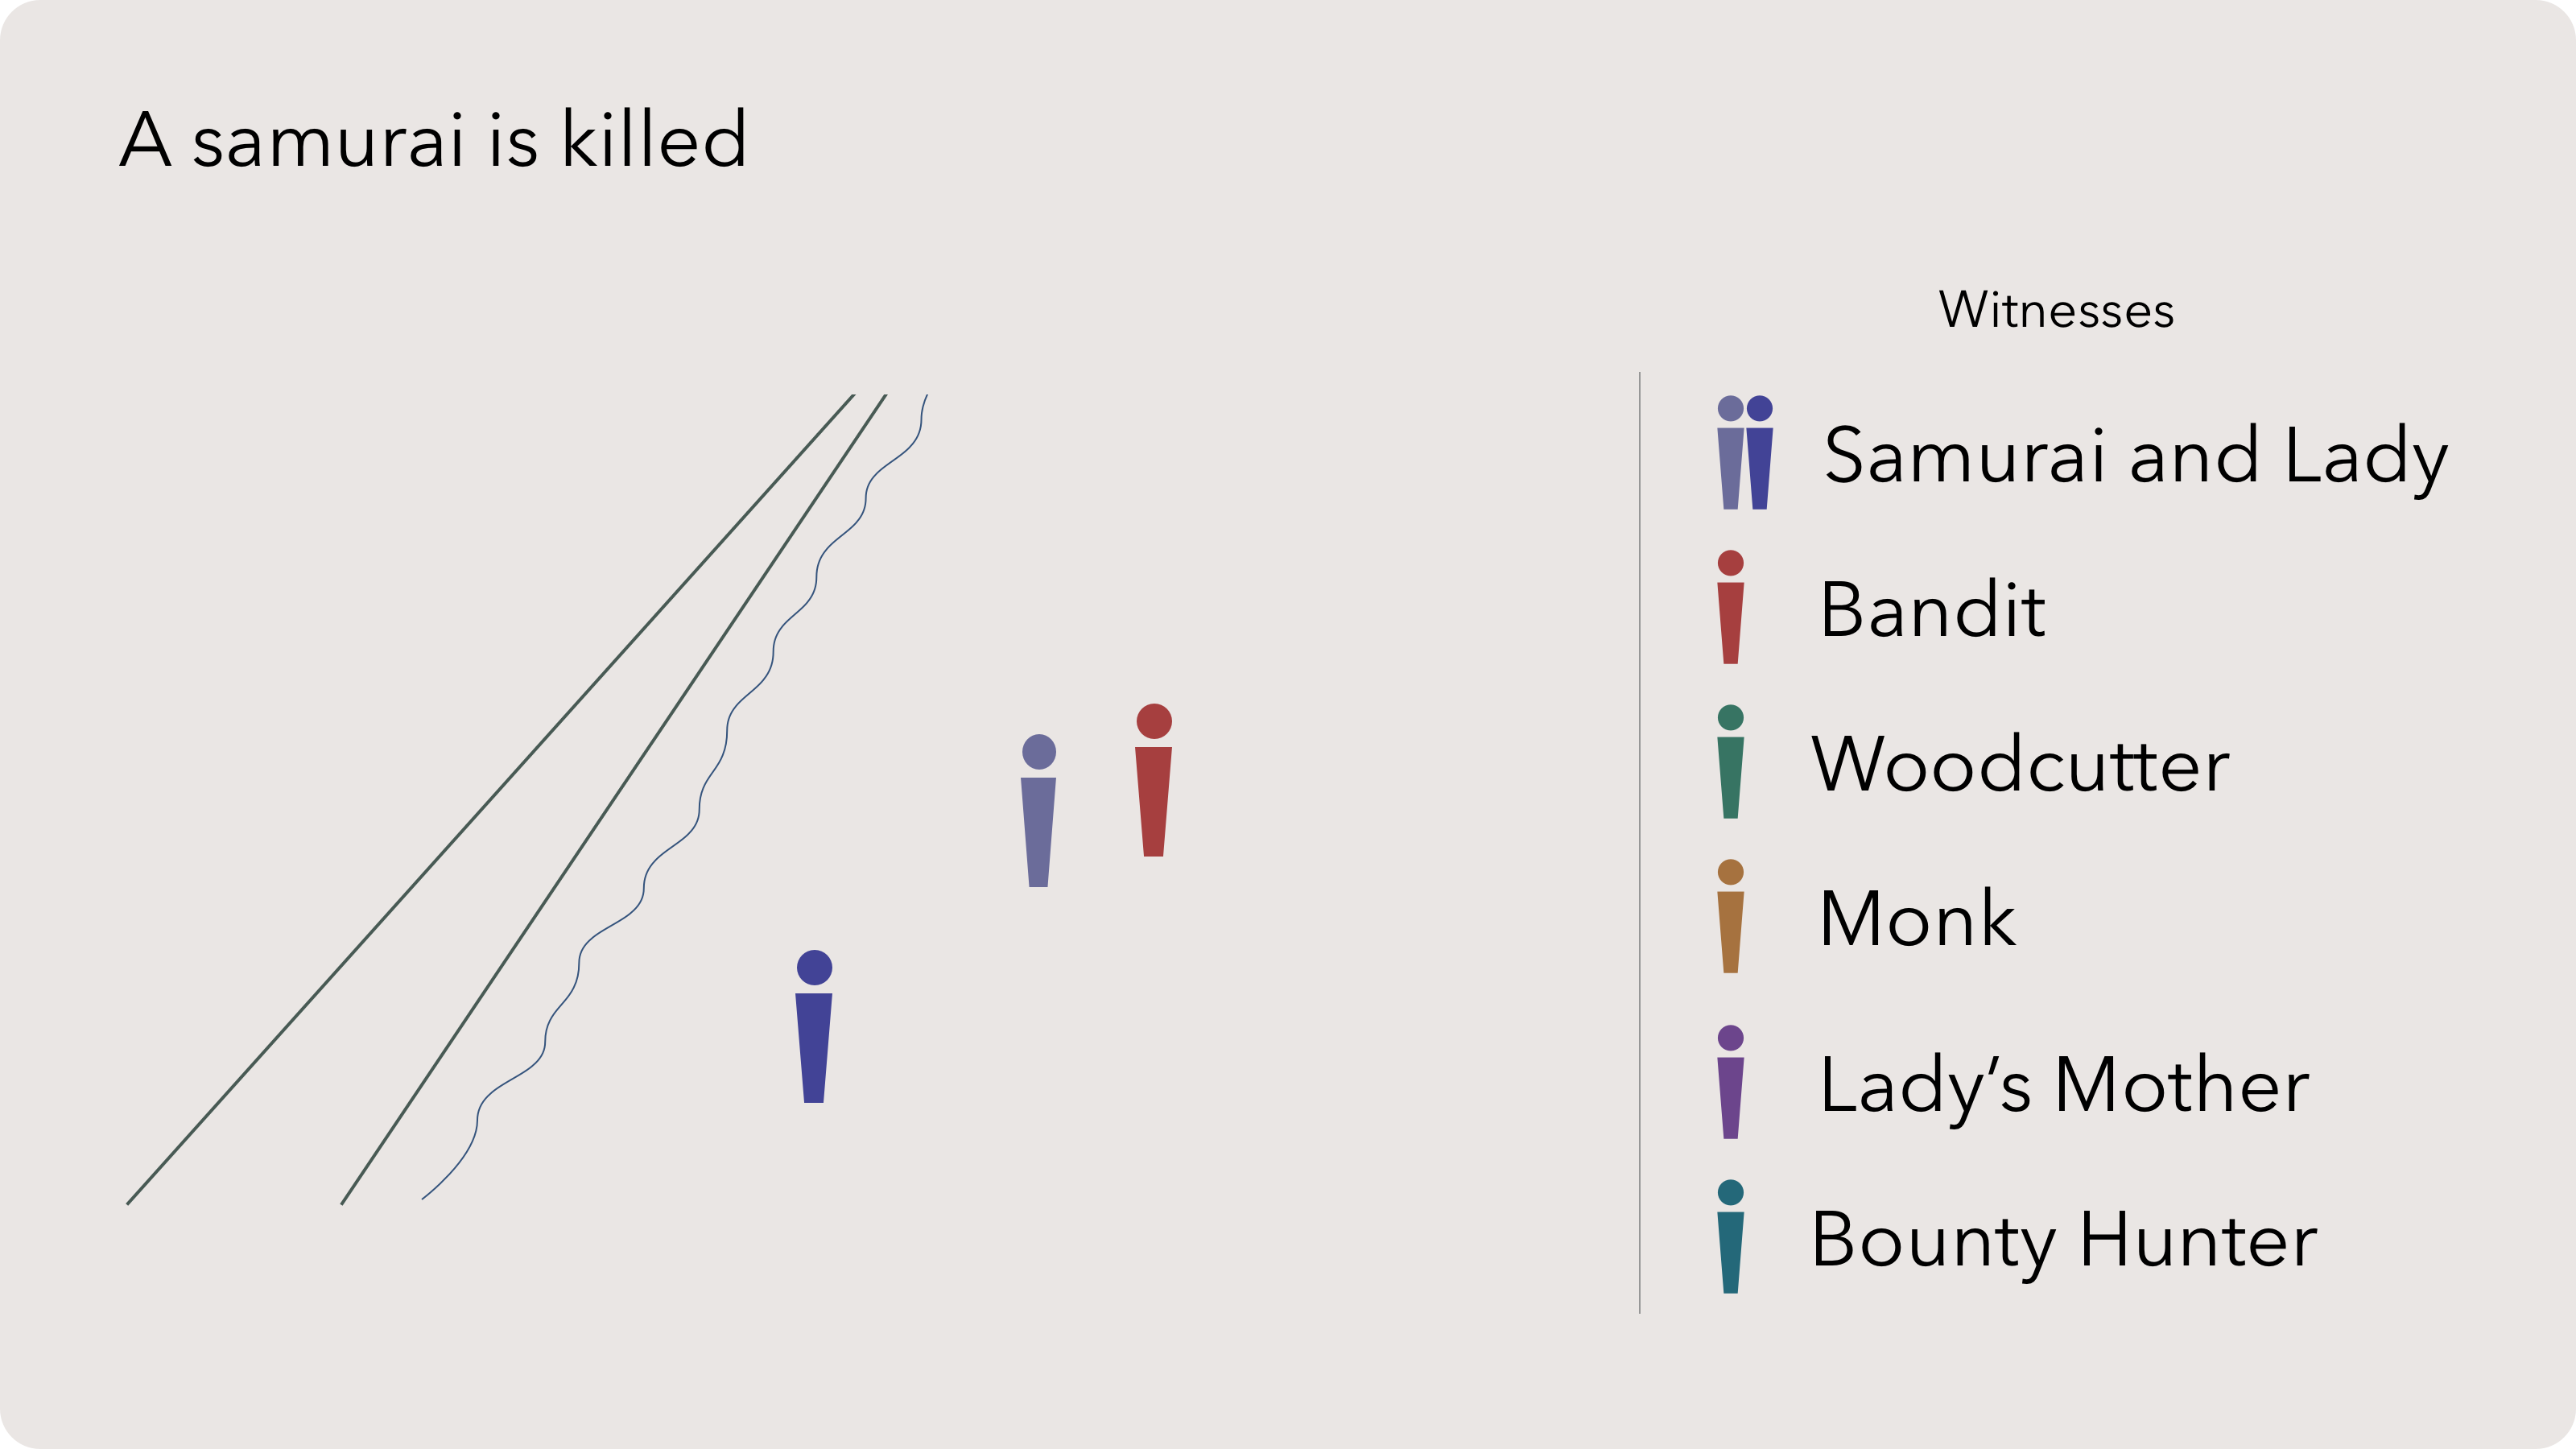
But the facts of the story begin to unwind as the witnesses are interviewed by a Police Investigator.
- A woodcutter stumbled across the body of the samurai and lays the groundwork of the scene.
- A monk describes the samurai and the Lady along the road before the encounter.
- The mother of the lady then describes the couples relationship and paints a portrait of a woman significantly different than what the Monk saw.
- A bounty hunter tells us about the apprehension of the bandit in custody, who was wanted for a variety of crimes. At the arrest, the bandit didn’t have any physical evidence linking him to the death in the grove.
- The bandit in custody confesses, after torture, to waylaying the samurai and lady by exploiting their greed for made-up secret treasure. After subduing the couple, he violated the Lady, who then goaded him into dueling the samurai. The bandit claims that he fought fair and struck down his opponent only to find the lady escaped during the violence.
- The Lady recounts a similar story but claims she stabbed her husband in the chest after the bandit robbed them and wandered off because she didn’t want her husband to live in shame.
- Finally, the ghost of the samurai shares his story. He reveals that his attacker was honorable and even freed him. However, he ultimately plunged a dagger into his own chest in disgrace. As he died, he witnessed the woodcutter tampering with evidence.
Evidence overlaps but is far from consistent
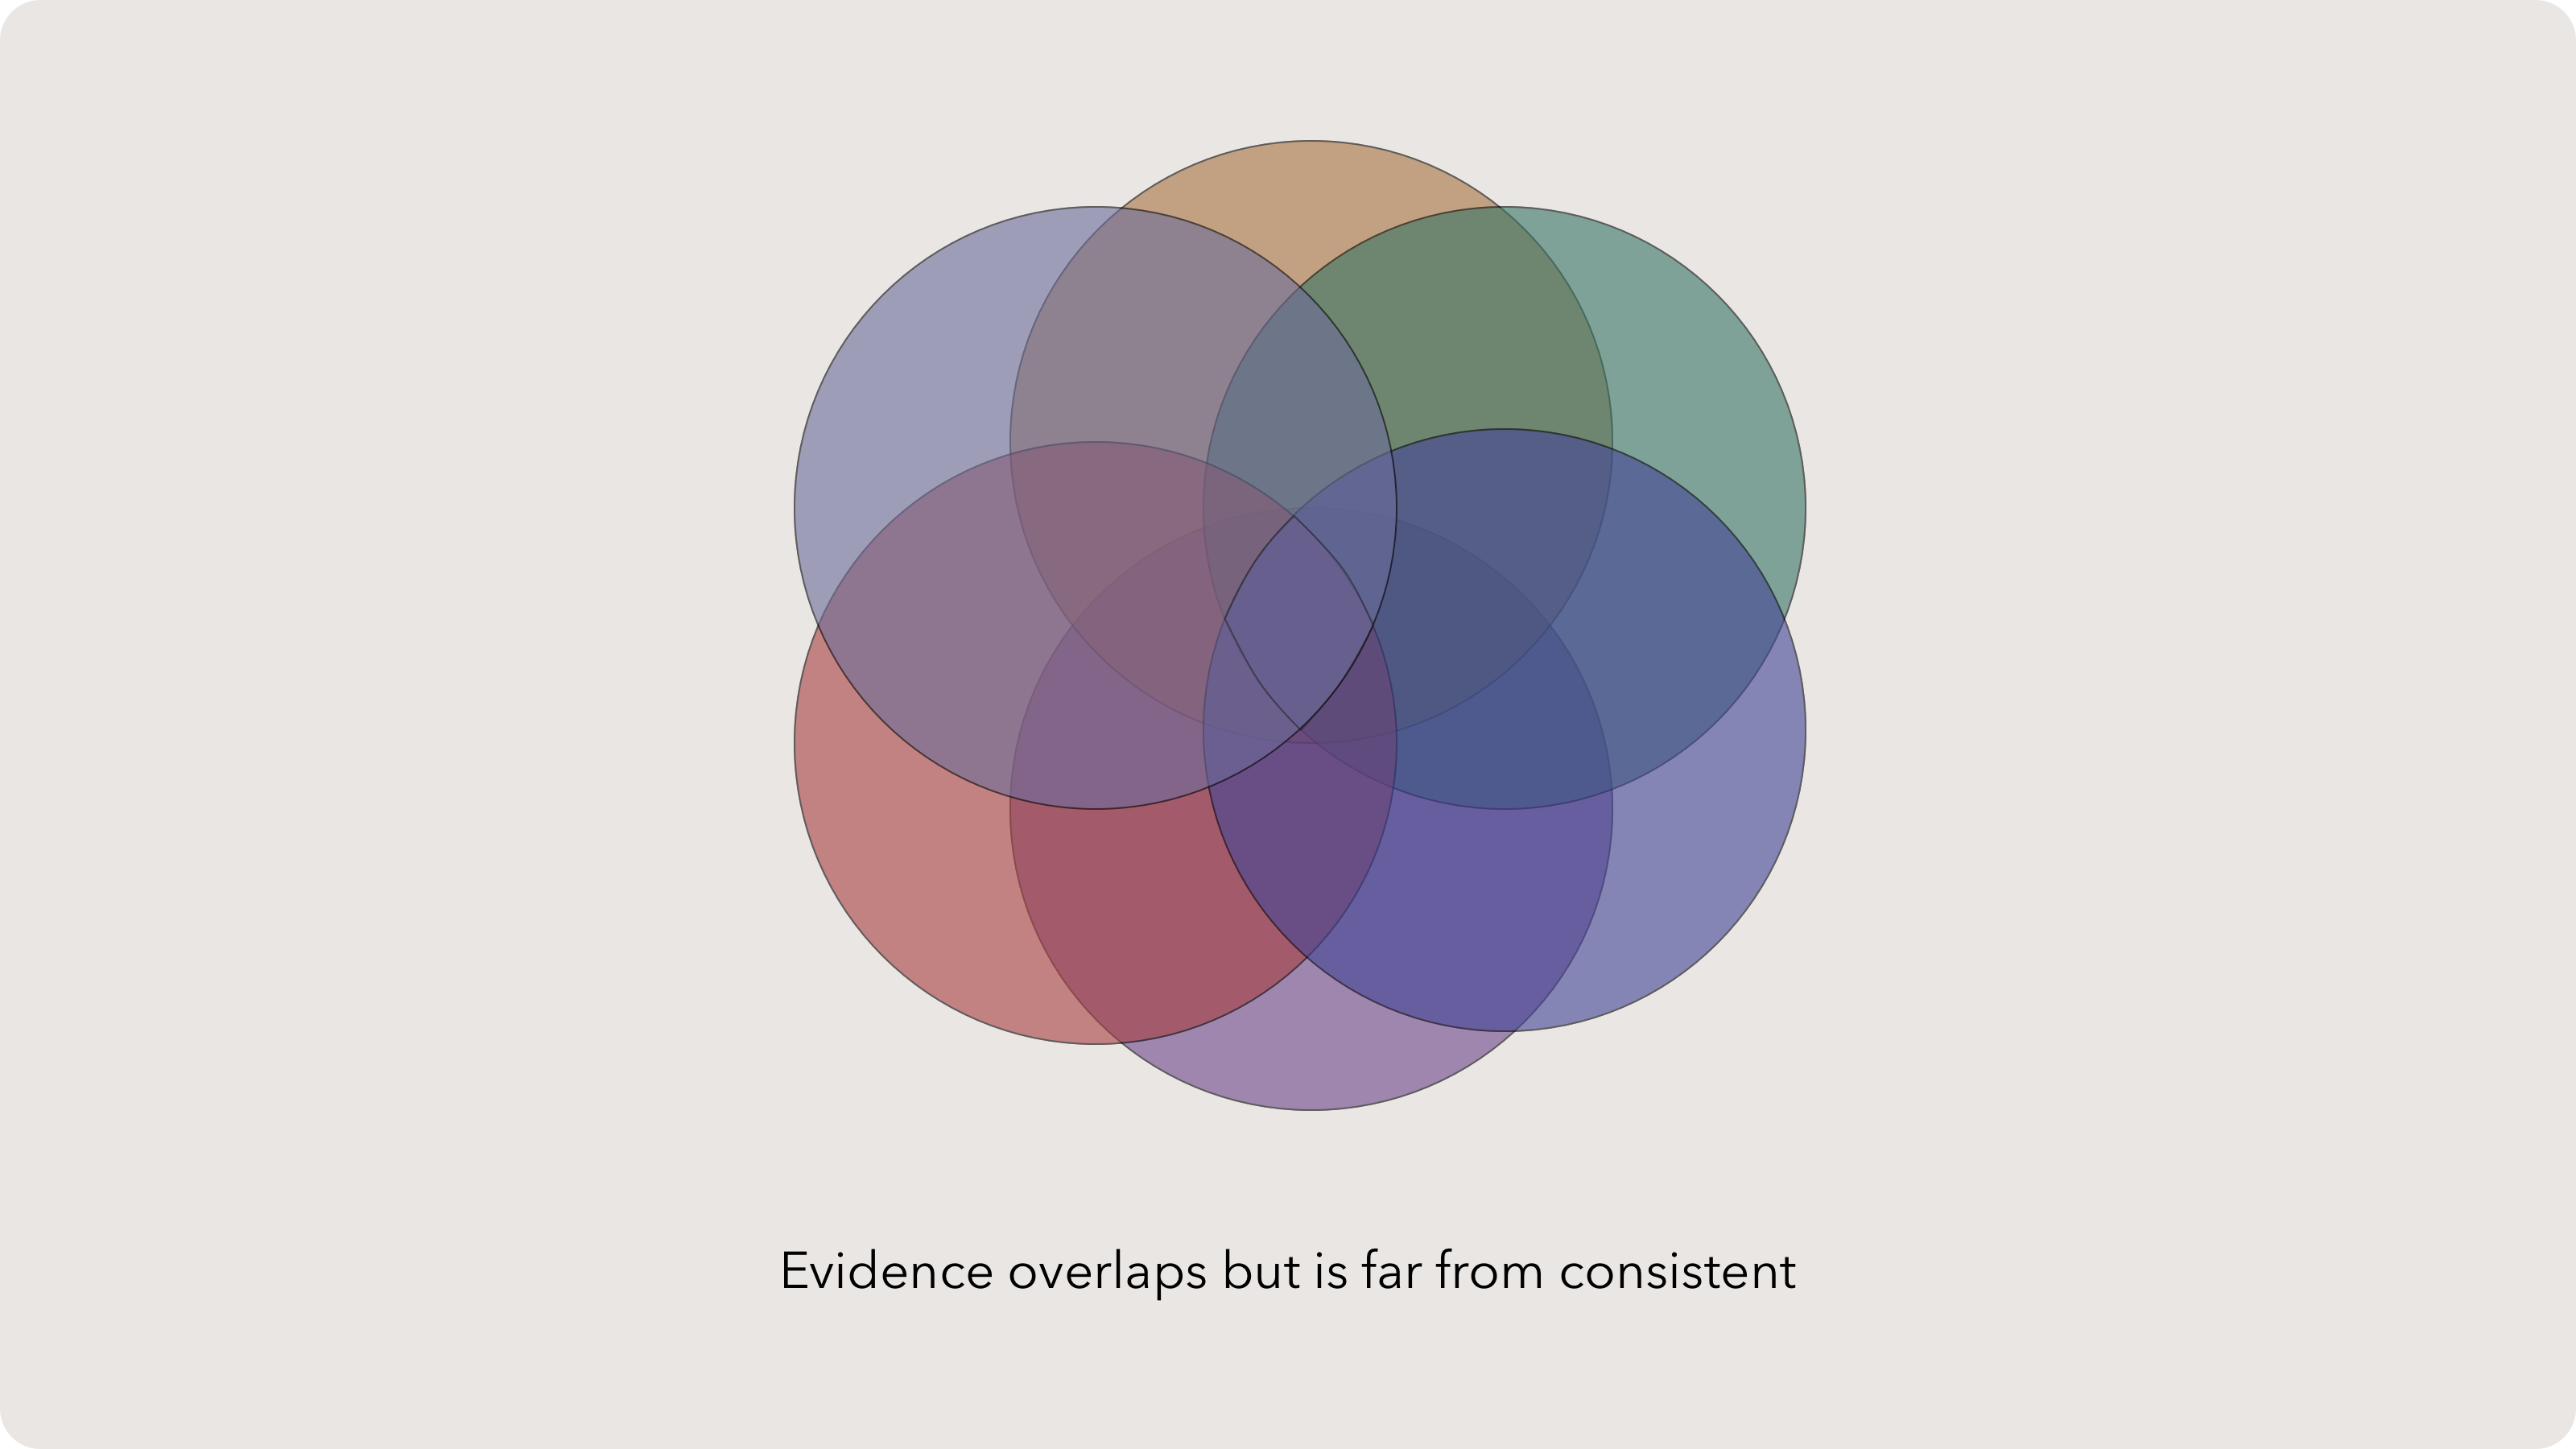
This defies our expectations: at the very least the victim, who has no earthly reason to lie, must be telling the truth! This is not a lesson on lying, although it may play a small part. In actuality, the objective truth is hidden from everyone, including the participants and especially the investigators.
Possible conclusions
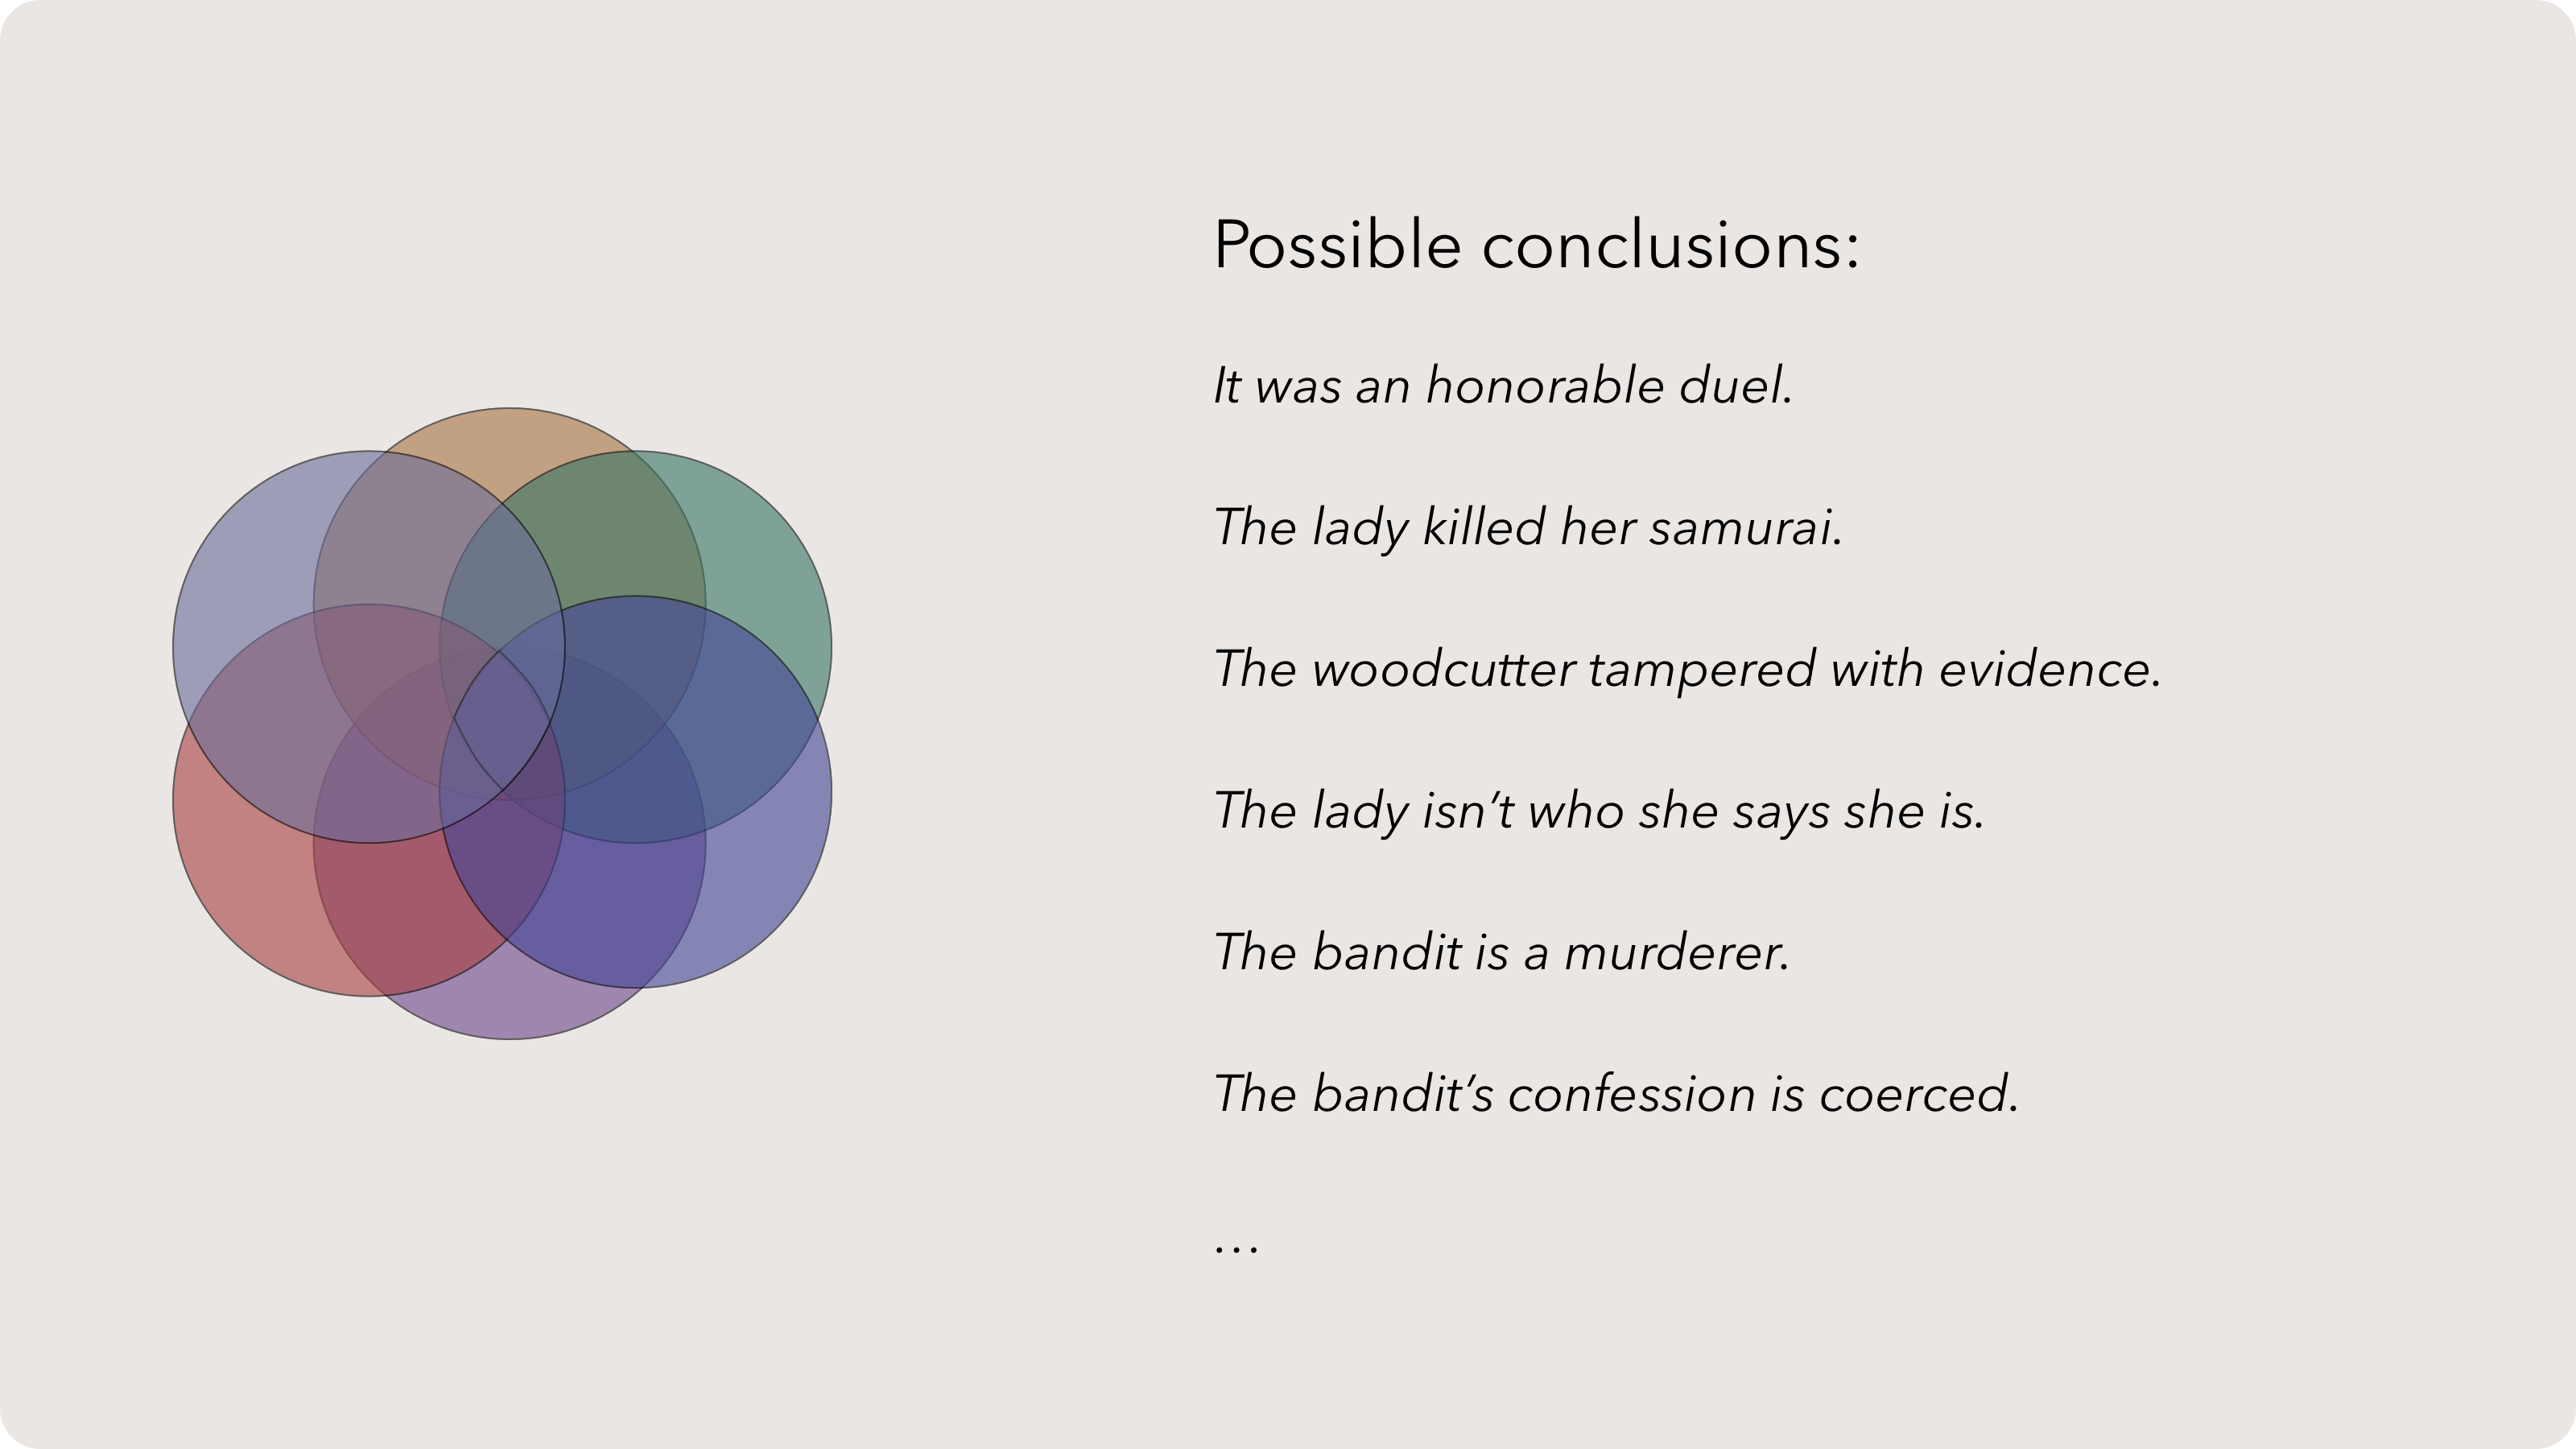
The flawed nature of human objectivity is the basis for our dependence on science and learning with data. But objective truth is still hard to find with pure data. A data scientist needs observational and analytical skills as well as the ability to synthesize these thoughts into clear and accurate statements.
Objective realities compete
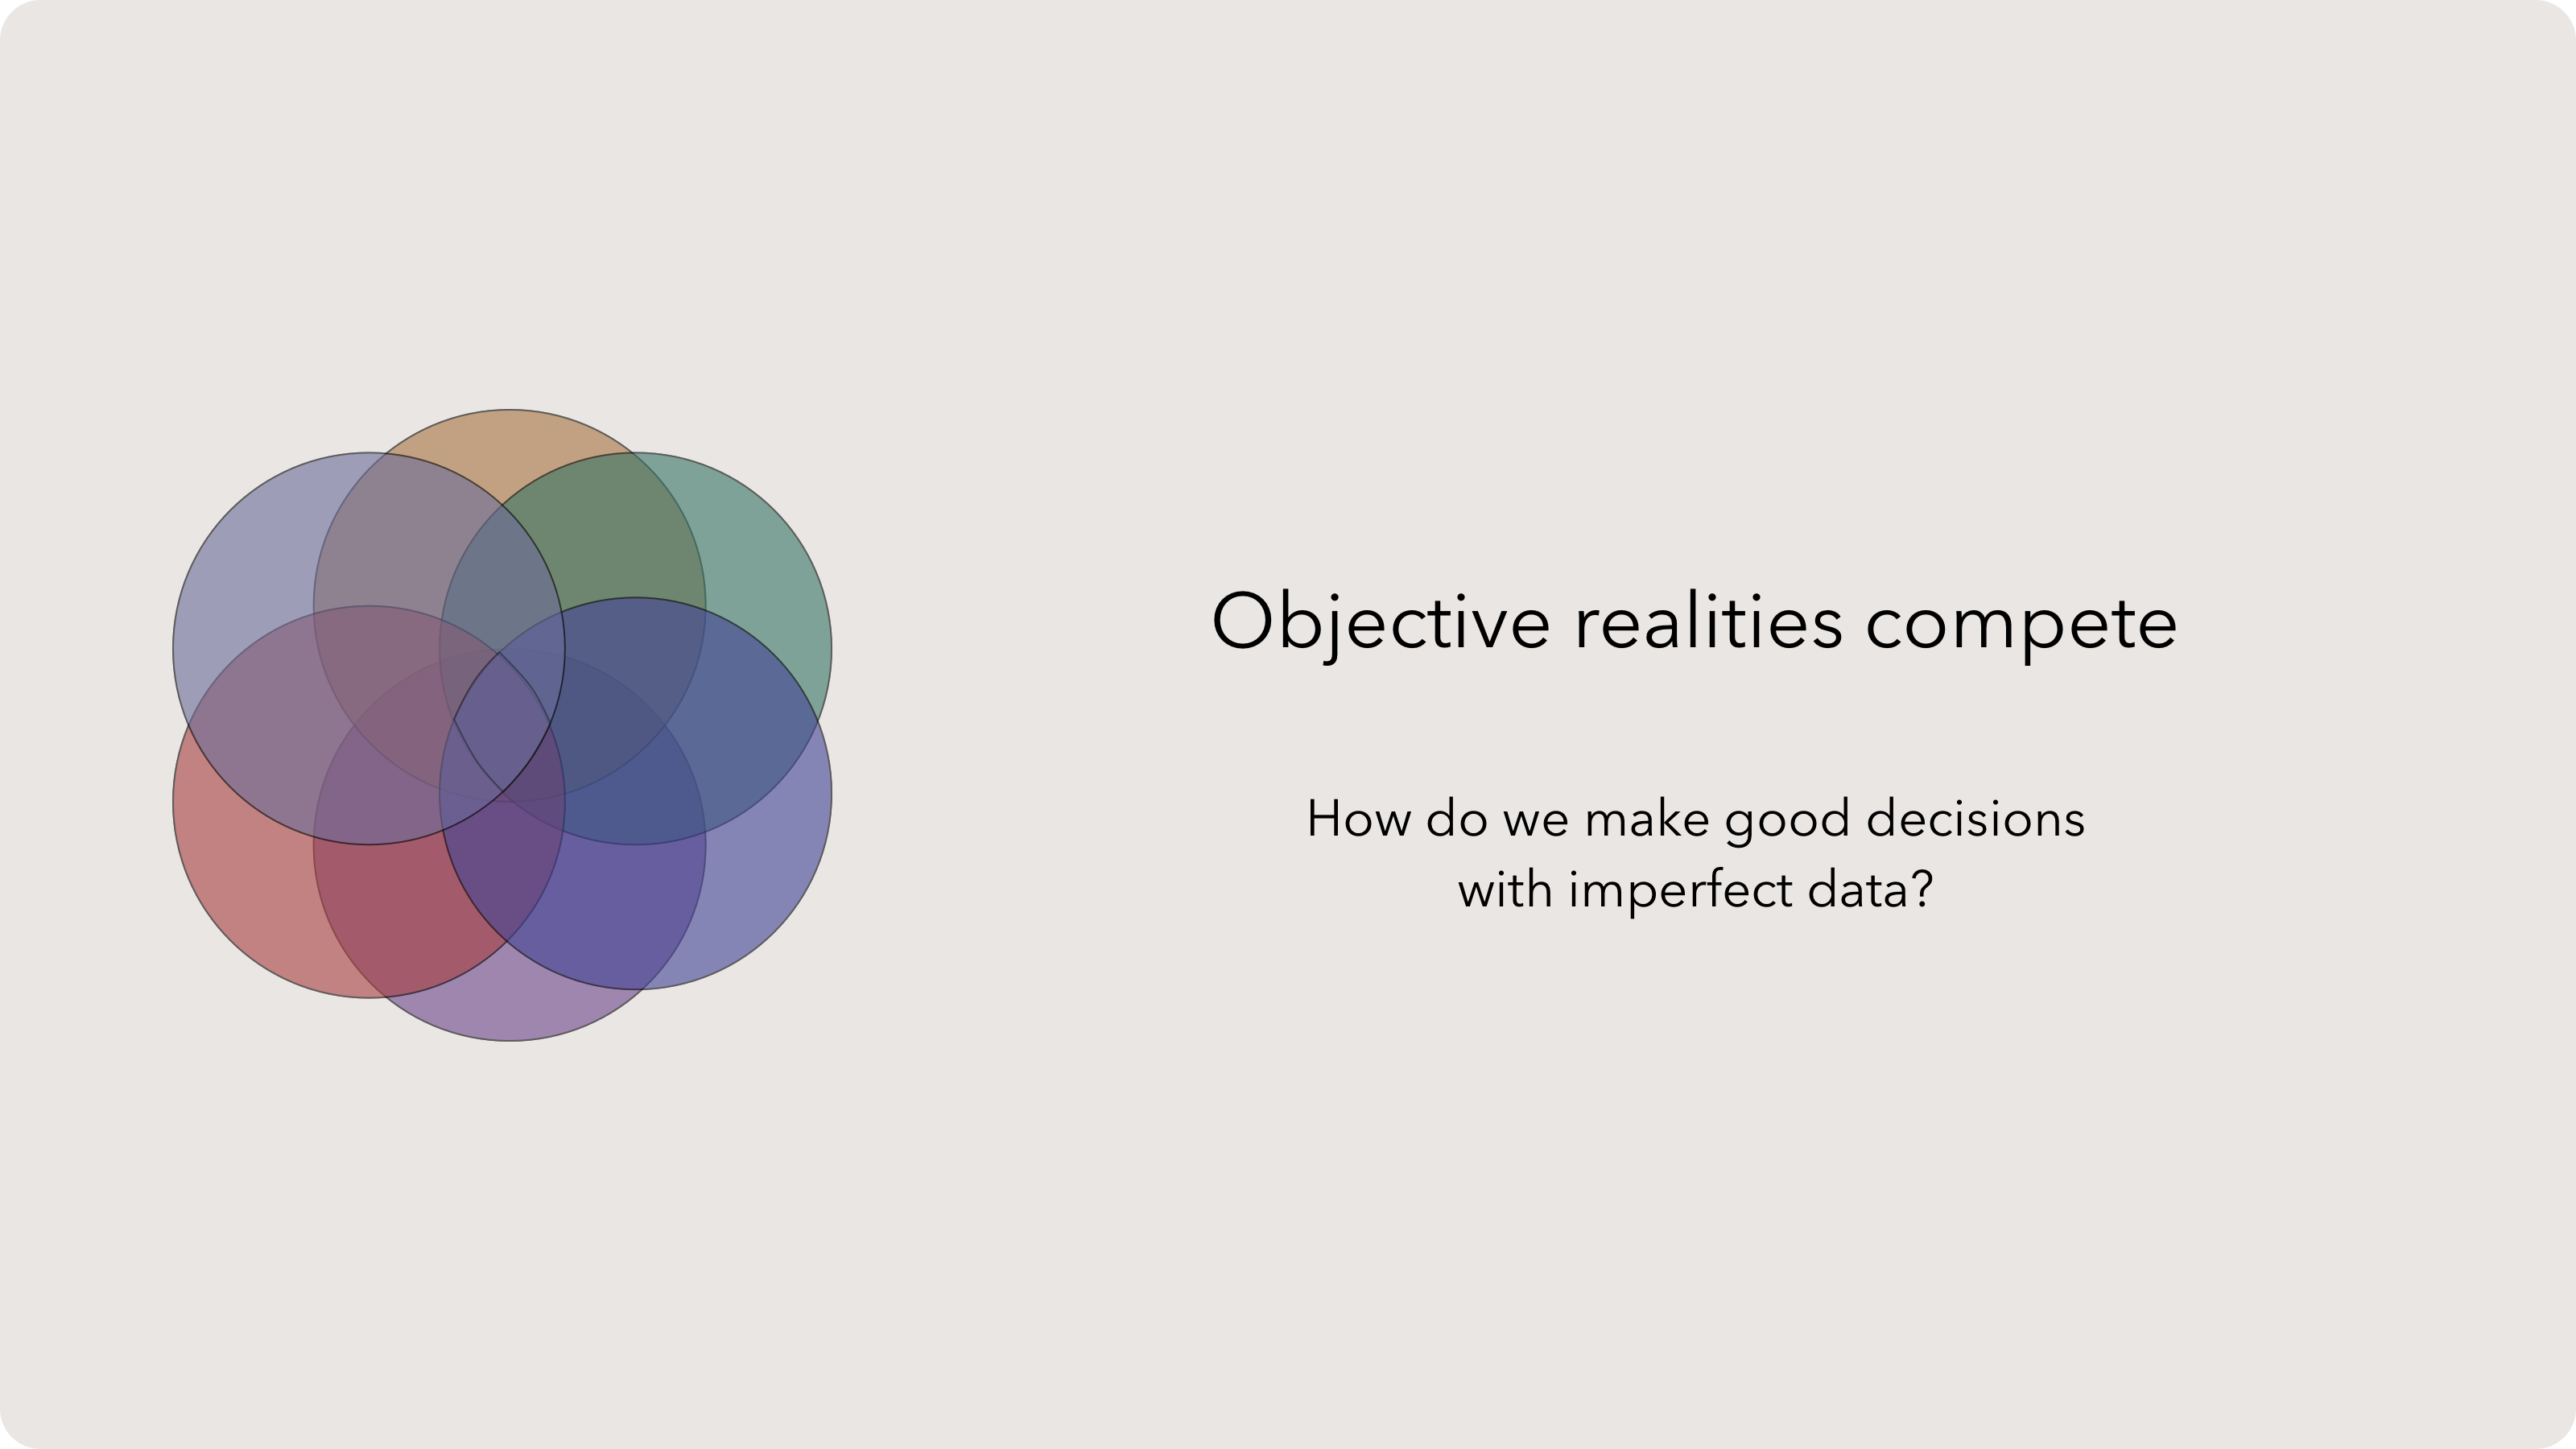
To further exacerbate the problem, human memory is innately bad. A famous study showed that when the human mind is focused on a task, our perception shuts off. In this study, adult volunteers didn’t notice a person in a gorilla costume walking by while they were playing a simple game of catch.
Do we give up on empiricism? No.
Instead we must ask: how do we make good decisions with imperfect data?
Data science is less of a profession and much more akin to a toolkit for thinking and answering that very question.
In this course, we’ll try to play gracefully with ideas using data. Science is about experimenting, so let’s enjoy our mistakes along the way.
A final precursor — this course is not:
- Inclusive of all techniques, tools, opportunities
- Intended as a replacement for advanced and more rigorous courses
Most courses
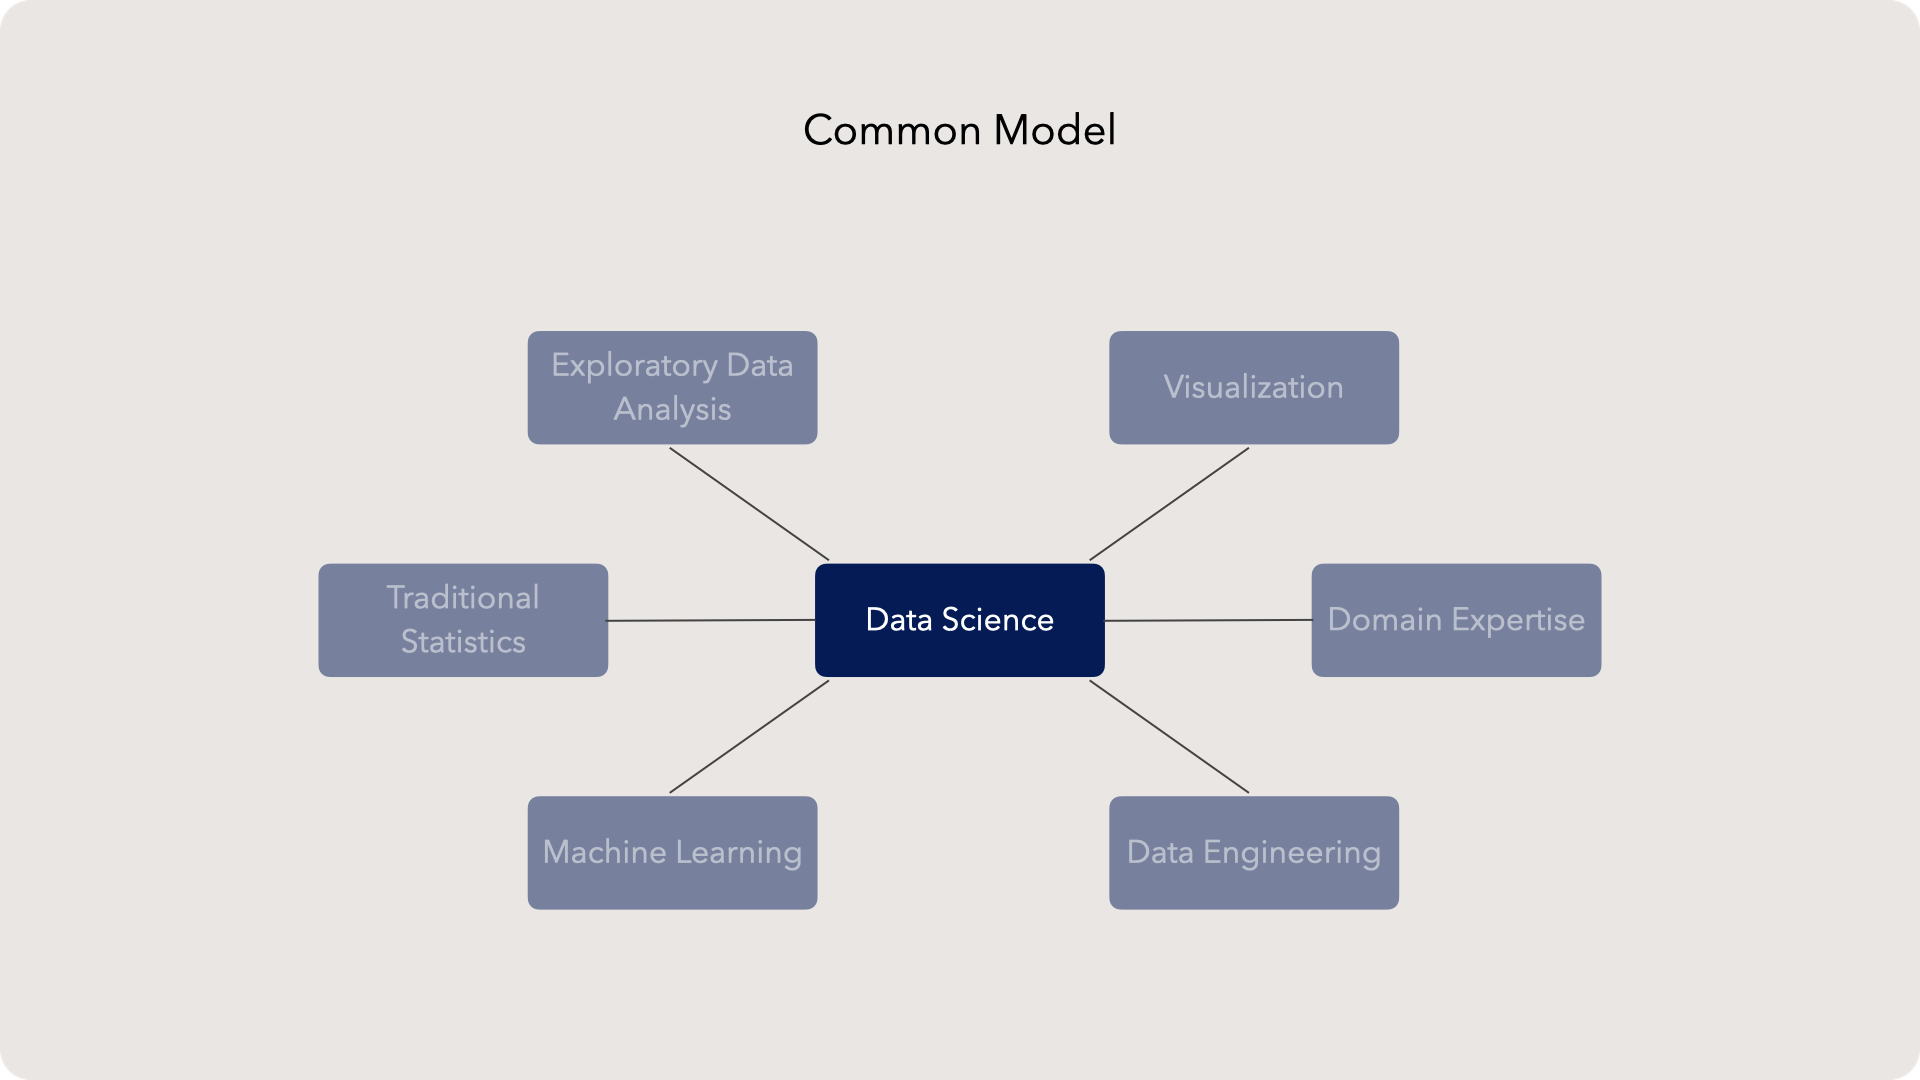
While you may need these skills, these topics are competencies for doing data science, not the skill of data science itself.
Of course the tools and skills are connected but I aim to teach data science from the perspective of thinking and asking questions. We'll touch on the tools as needed as we focus on the core ideas that enable our work.
The reason for this approach is three fold:
- The common model was designed to fill a skilled labor gap in tech. The big data explosion meant that corporations needed a ton of new data professionals. Schools designed education around producing hirable employees. This made sense for a while, but we have to be careful not to flood our industry with what info-sec hackers call "script-kiddies"–or programmers that are good enough to use pre-existing techniques but don't have the foundational knowledge to invent artfully.
- Data science techniques are evolving fast. No one can keep up. How do we stay relevant? Richard Hamming, one of the famed mathematicians in Bell Labs and an excellent thinker on AI, has this solution: learn the fundamentals of your disciplines really well. The half-life of a specific algorithm is years, the half-life of the linear algebra controlling the algorithm is centuries. It's better to play catch up on a specific technique as you need to then to lack the background to evolve.
- Data science tools are becoming commodities. Natural language processing, computer vision, and nearly every application of machine learning already has AWS or Azure models pre-built. Anyone can sign up and get something that is nearly good enough. But the distance between good and great is not bridged with a slightly better python script. The difference is understanding the nature of the tools themselves.
This course’s approach: align questions to techniques
Journalists are taught about the fundamental questions of reporting:
- Who
- What
- Why
- When
- Where
- How
These questions orient a reader to events, providing the foundation for further discussion.
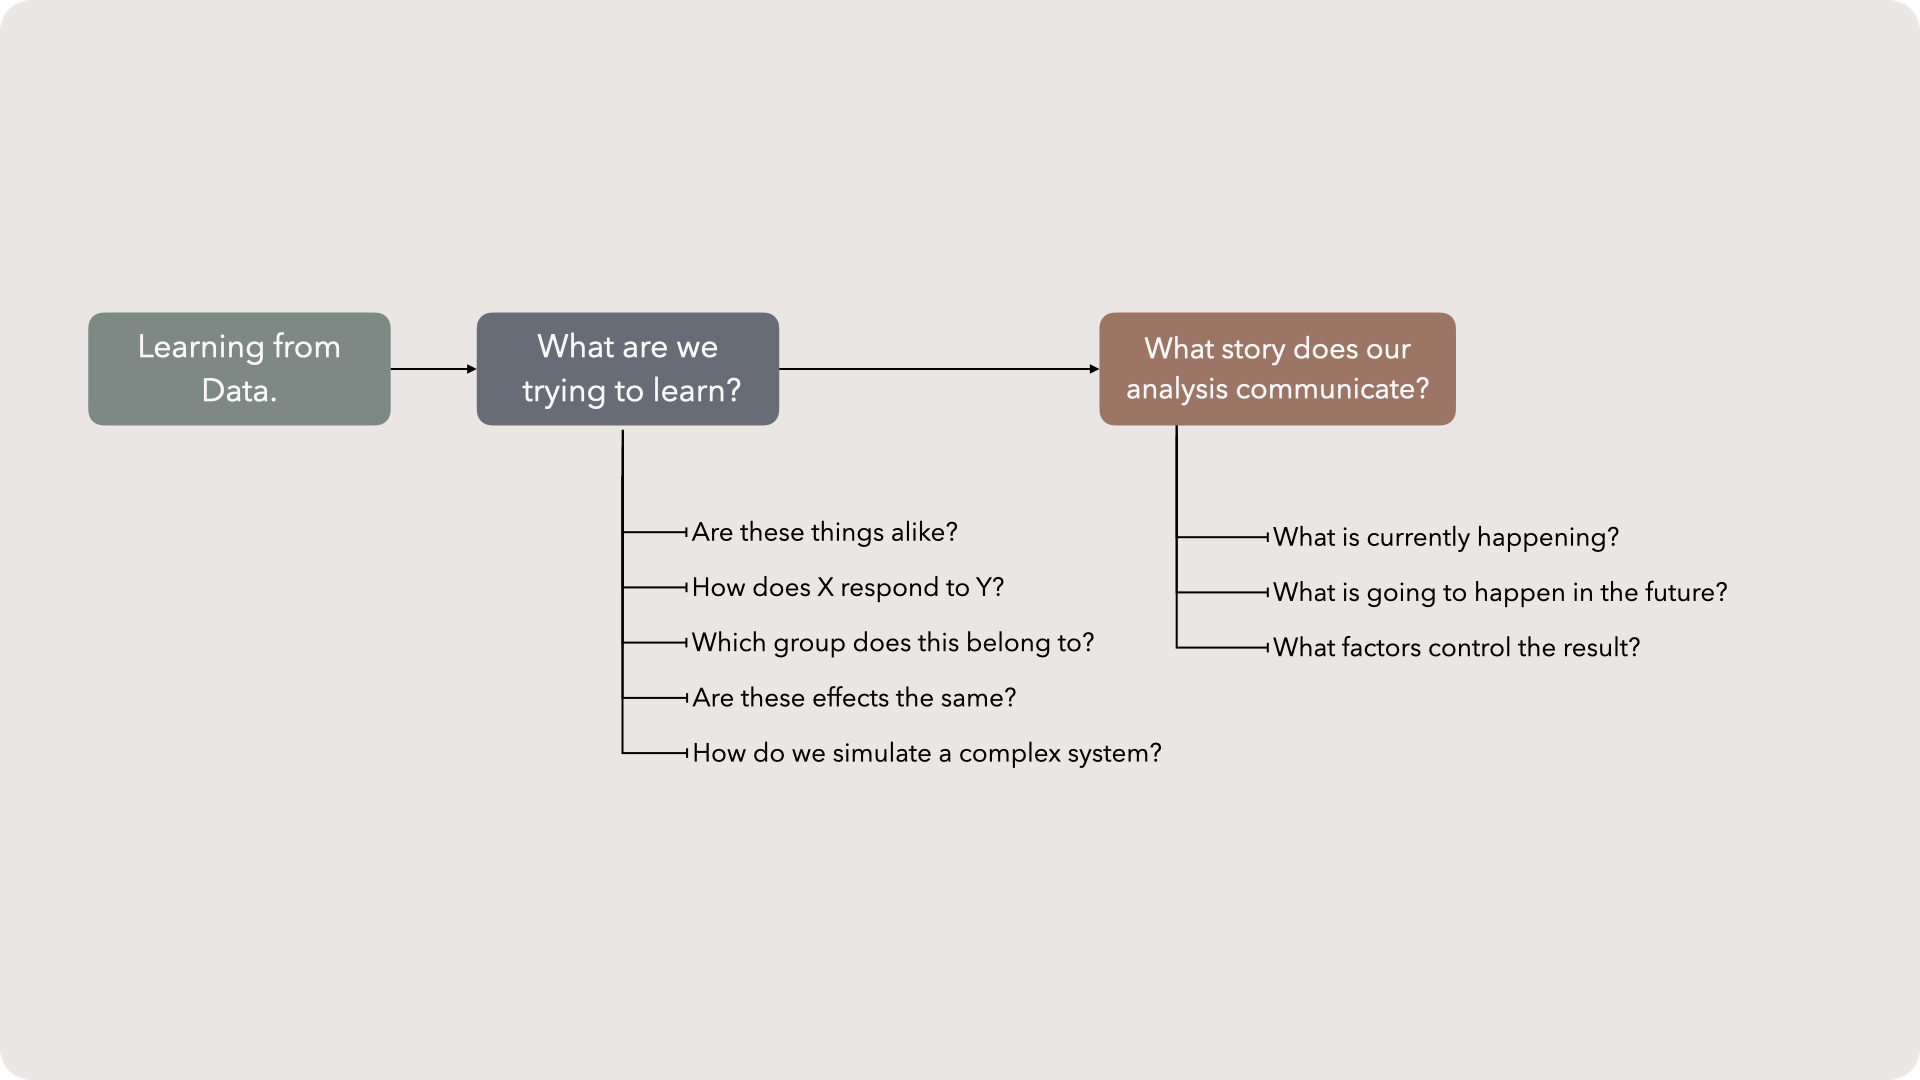
Likewise, data science has several fundamental questions that shape our learning efforts:
- Are these things alike?
- How does X respond to Y?
- Which group does this belong to?
- Are these effects the same?
- How do we simulate a complex system?
Obviously, there can be other questions, but these five map to our most common tools like clustering, traditional statistics, or regression. Each of these questions will have its own discussion. The important thing is this: data science tools are rapidly changing, so there is no singular right approach. Don't be afraid to experiment (this is science after all), but we can use these questions as guides. Often, you’ll be tying these questions, and the corresponding tools, together to answer a more complicated question.
For example, what if we wanted to scratch build a plagiarism detector? We would be taking two samples of writing, or some media format, and checking them against each other. This sounds like a good opportunity to ask if these two things are a like, which would lead us towards a clustering-based solution. The solution would require a lot of thinking on how we encode our data.
Data preparation is a huge part of data science, whether you like it or not. We’ll do a dive into feature engineering, data shaping, cleaning and imputation before we cover the fundamental questions of DS.
Finally, analytics is often tuned to one of three story archetypes:
- What is the current state?
- What is the future state?
- Which factors control the state?
You may recognize these as descriptive, predictive, and prescriptive analytics. This course won’t focus on these patterns but we’ll touch on them here and there. One brief editorial about these analytic types: prescriptive analytics is the future. All analysis is about learning from data. But why learn? Sometimes it is just to satisfy our curiosity but often it is because we know we need to act. Prescriptive analytics gets us one step closer to action by highlighting the control knobs for change.
Ok - so you’ve been briefed on the theory driving this course, but now we need to talk about our main implement: the model. Let’s talk about what I mean by a model and some principles that guide the development of one.
Models are not reality

Models are chief among our mental tools for exploring reality. Models are like maps: useful but not the place themselves. A map of the coast near Sydney will help us figure out how to get to Wollongong, but isn’t the sandy beaches of Australia. This abstraction is keenly powerful.
Models and maps are essentially the same thing. A model is an imperfect way to navigate reality. It shows a bird’s eye view of a topic, but it will rarely make individual samples perfectly understood, especially when the samples are as complex as people. With modern technology, contemporary models are jumping in quality from “good enough” to excellent. Netflix’s recommendation engine for what to watch next was a massive win for predictive modeling at the individual level, but it still isn’t perfect. In fact, some philosophers of science claim that a perfect model has a single name: reality.
Thinking back to the map example, what would a 1-to-1 scale model of Sydney with all of its inhabitants, food and art be called? Sydney.
Models and maps are nowhere close to 1-to-1 scale, but they are useful tools. So in this course, we’ll define a model as: an abstraction that helps us make better decisions in reality. In practice, this means models will often be mathematical functions or algorithms that take an input data set and outputs a result.
Lumping vs splitting
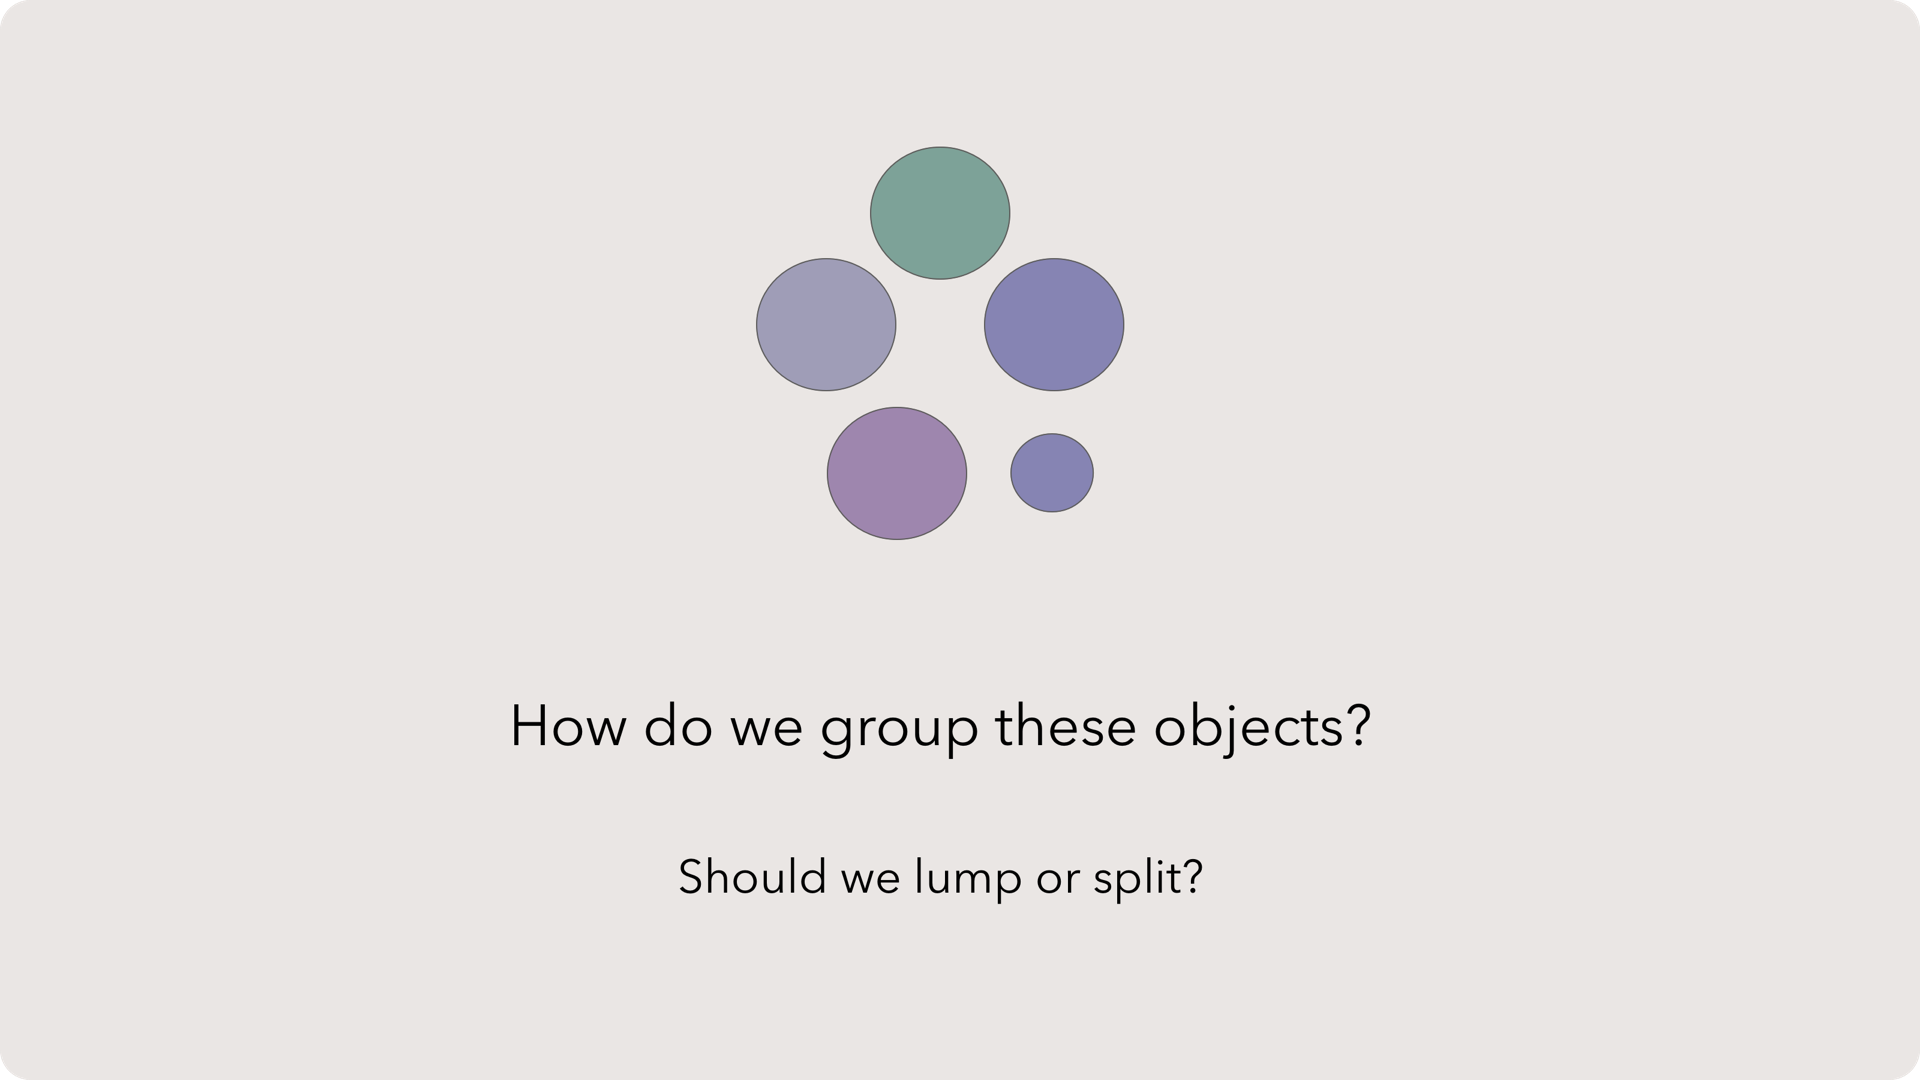
Lumping things together doesn’t sound precise, nor does splitting. But we lump data into aggregates so our minds can make sense of patterns. Remember, our brains are the product of natural selection favoring the paranoid — using patterns to create imaginary threats was a more successful strategy than ignoring all patterns and being blindsided by a lion.
For example, we often use “generations” to explain changes in society and culture. As a millennial, I hate it when I’m lumped into spending all my money on avocado toast. This mental model of spending habits borders on ignorant stereotype. But there is some function: millennials are more likely to spend money on healthy food, more frequently compared to previous generations. That crude lumping by age actually tells us many interesting things — like how wellness is a chief concern of a generation.
There are plenty of examples of lumping and splitting — you will find yourself tending to one over the other. Neither is better, both are powerful in their crudity. But remember the first point: models are not reality. Just because you lumped a subject into a group, it doesn’t mean the subject has the same attributes as its peers.
Explainability beats all
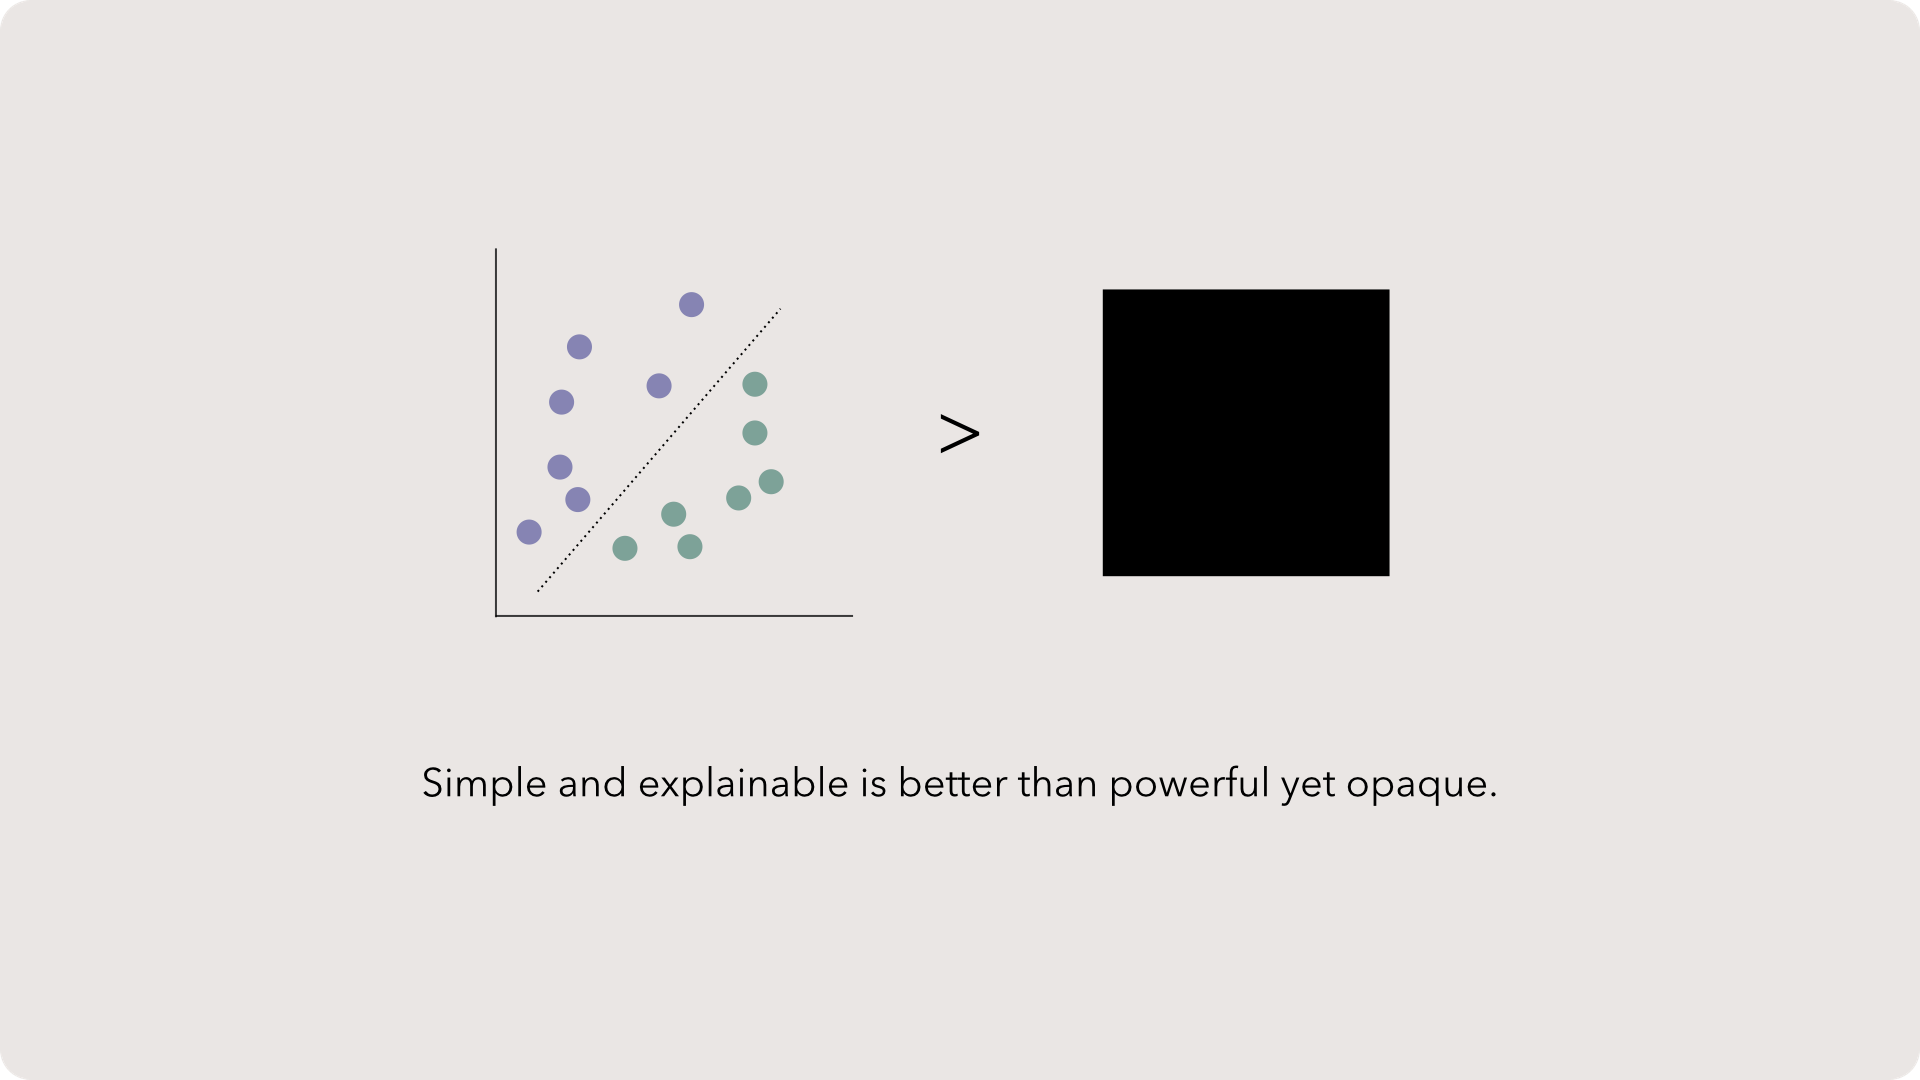
Simple models, with just a few dimensions, often perform just as well as more complicated and comprehensive models. It’s okay to drop a bit of power for a simpler approach.
The reasons are:
- Adding tons of dimensions is tempting, as more dimensions means less abstraction because we are including more of reality right? Sort of… but with each additional dimension, we need enough samples to represent each combination of dimensions. Otherwise, we’ll have a few records that could have higher influence. Though you get a massive dataset, with the combinatorial explosion of data, you’re now prone to spurious correlations from random intersections of data. This entire point could be a deeper dive into the curse of dimensionality, but for now, let’s leave it as this: more dimensions creates more problems. Use enough to create a good model (which requires your judgement) and no more.
- Additionally, a simpler model is easy to explain. And an explainable model is more likely to prompt action. Remember, the future is in prescriptive analytics.
Components of most models
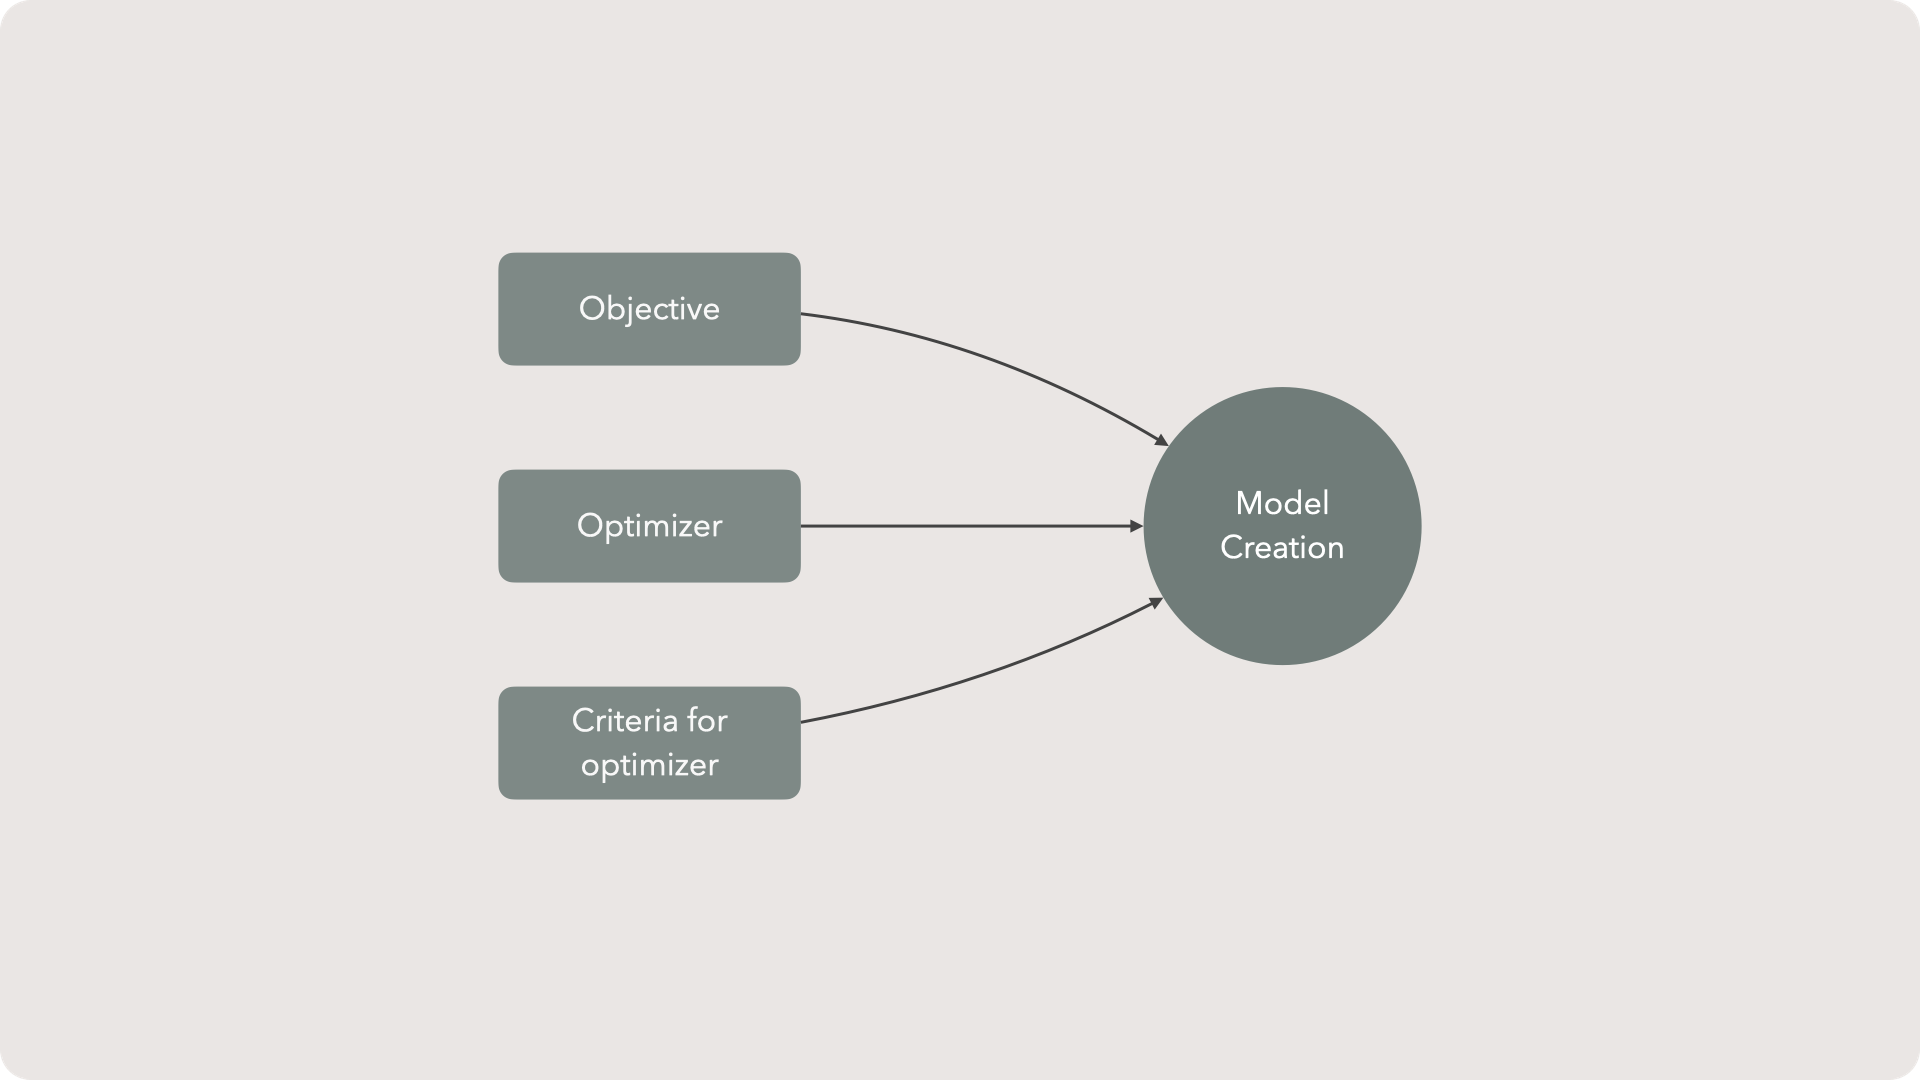
In general, models have three components.
- Objective - an objective, or objective function, represents our ideal solution. Typically this means we want to minimize or maximize some metric. Often we want to minimize the average error between a predicted and actual value.
- Optimizer - this is how the tool will try different solutions. The optimizer is going to take our data and iterate over several variations of models. The best model will be selected for our use. The most common optimizers perform gradient descent optimization.
- Criteria for optimizer — this is what changes during each optimization cycle. You can think of these as parameters for the optimizer to play with to find the best objective.
Don’t worry if this isn’t crystal clear. For now, the key take away is that we’ll use three components to build a data science model. The regression chapter will make this very clear using a linear model.
Measure, Learn, Do
