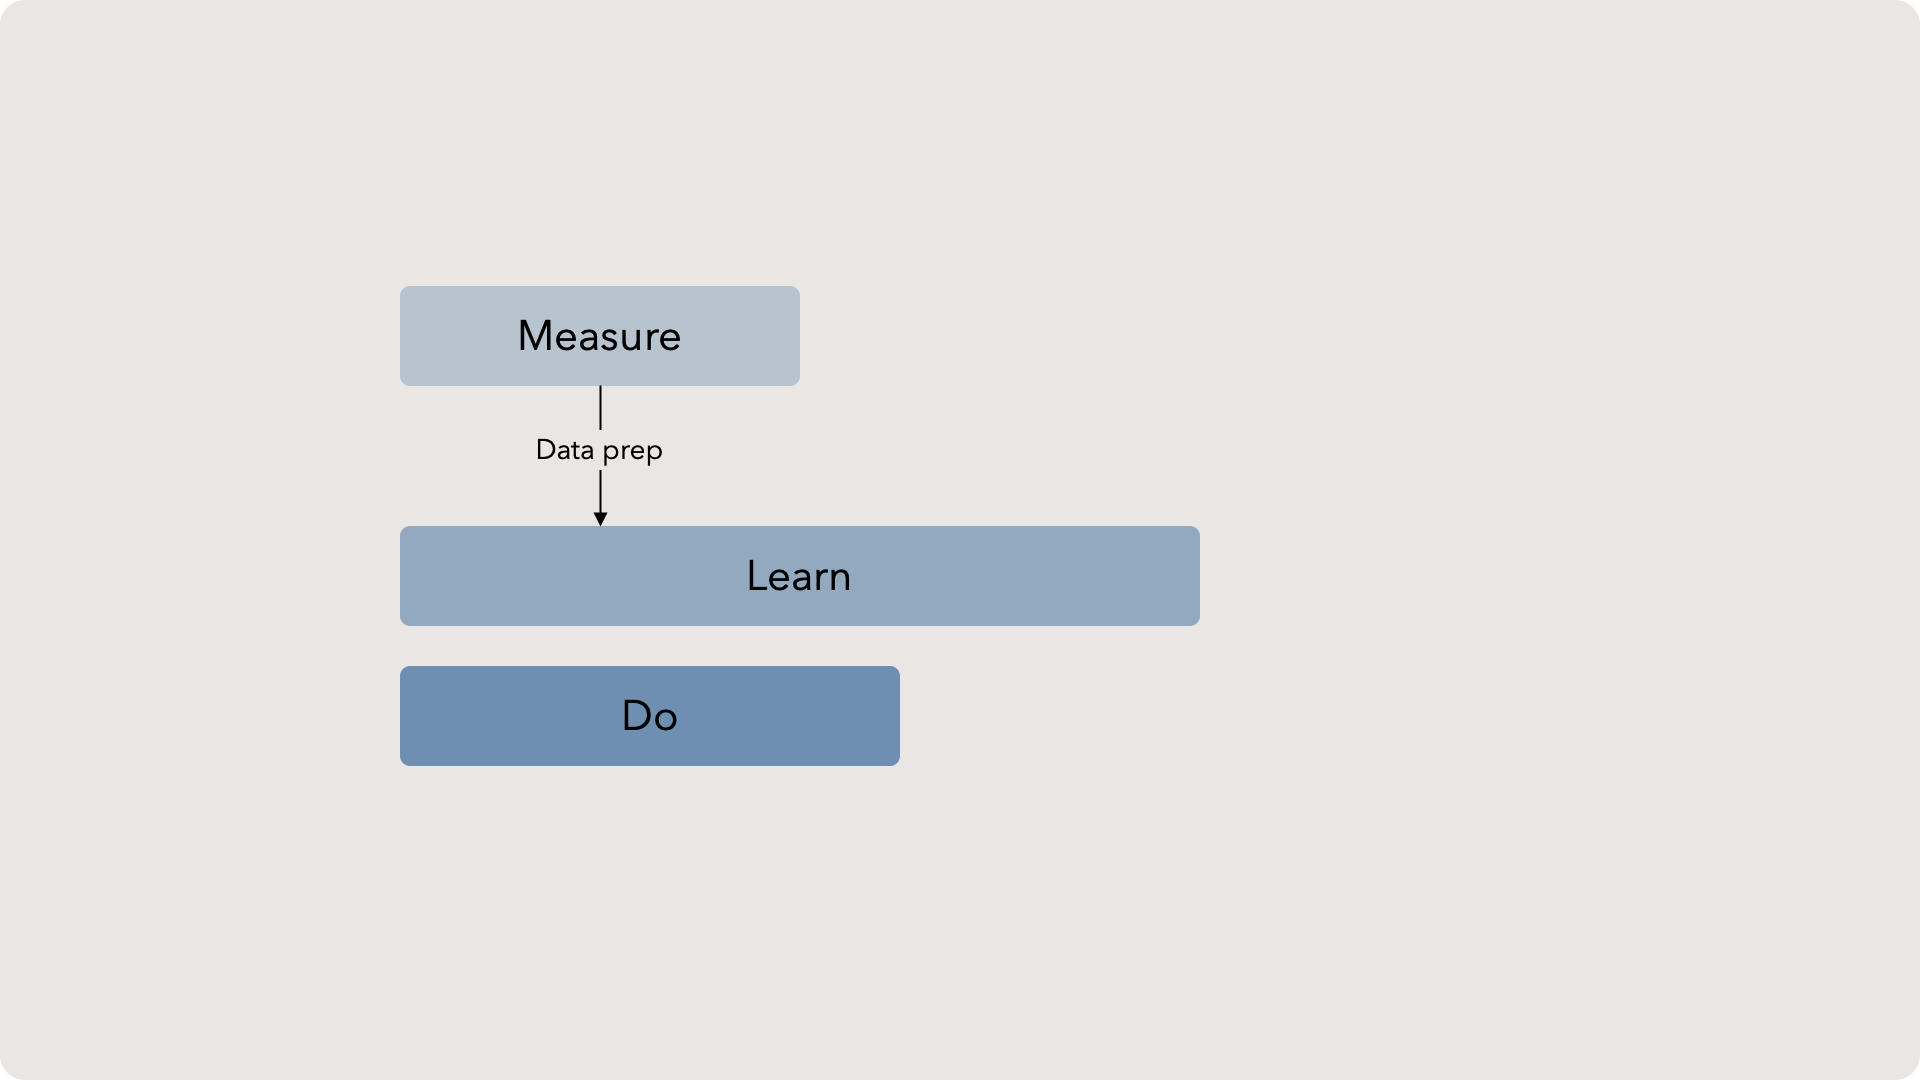
Preparing data for analysis
In this part of the series, we’ll discuss cleaning up data and getting it ready. That doesn’t just mean fixing 'data typos', but also engineering different data types into something more malleable.
Understanding Dimensions and Measures
So it should be no surprise that our data often arrives unsuitable for immediate use. To make sense of our messy data, we need to understand the anatomy of datasets.
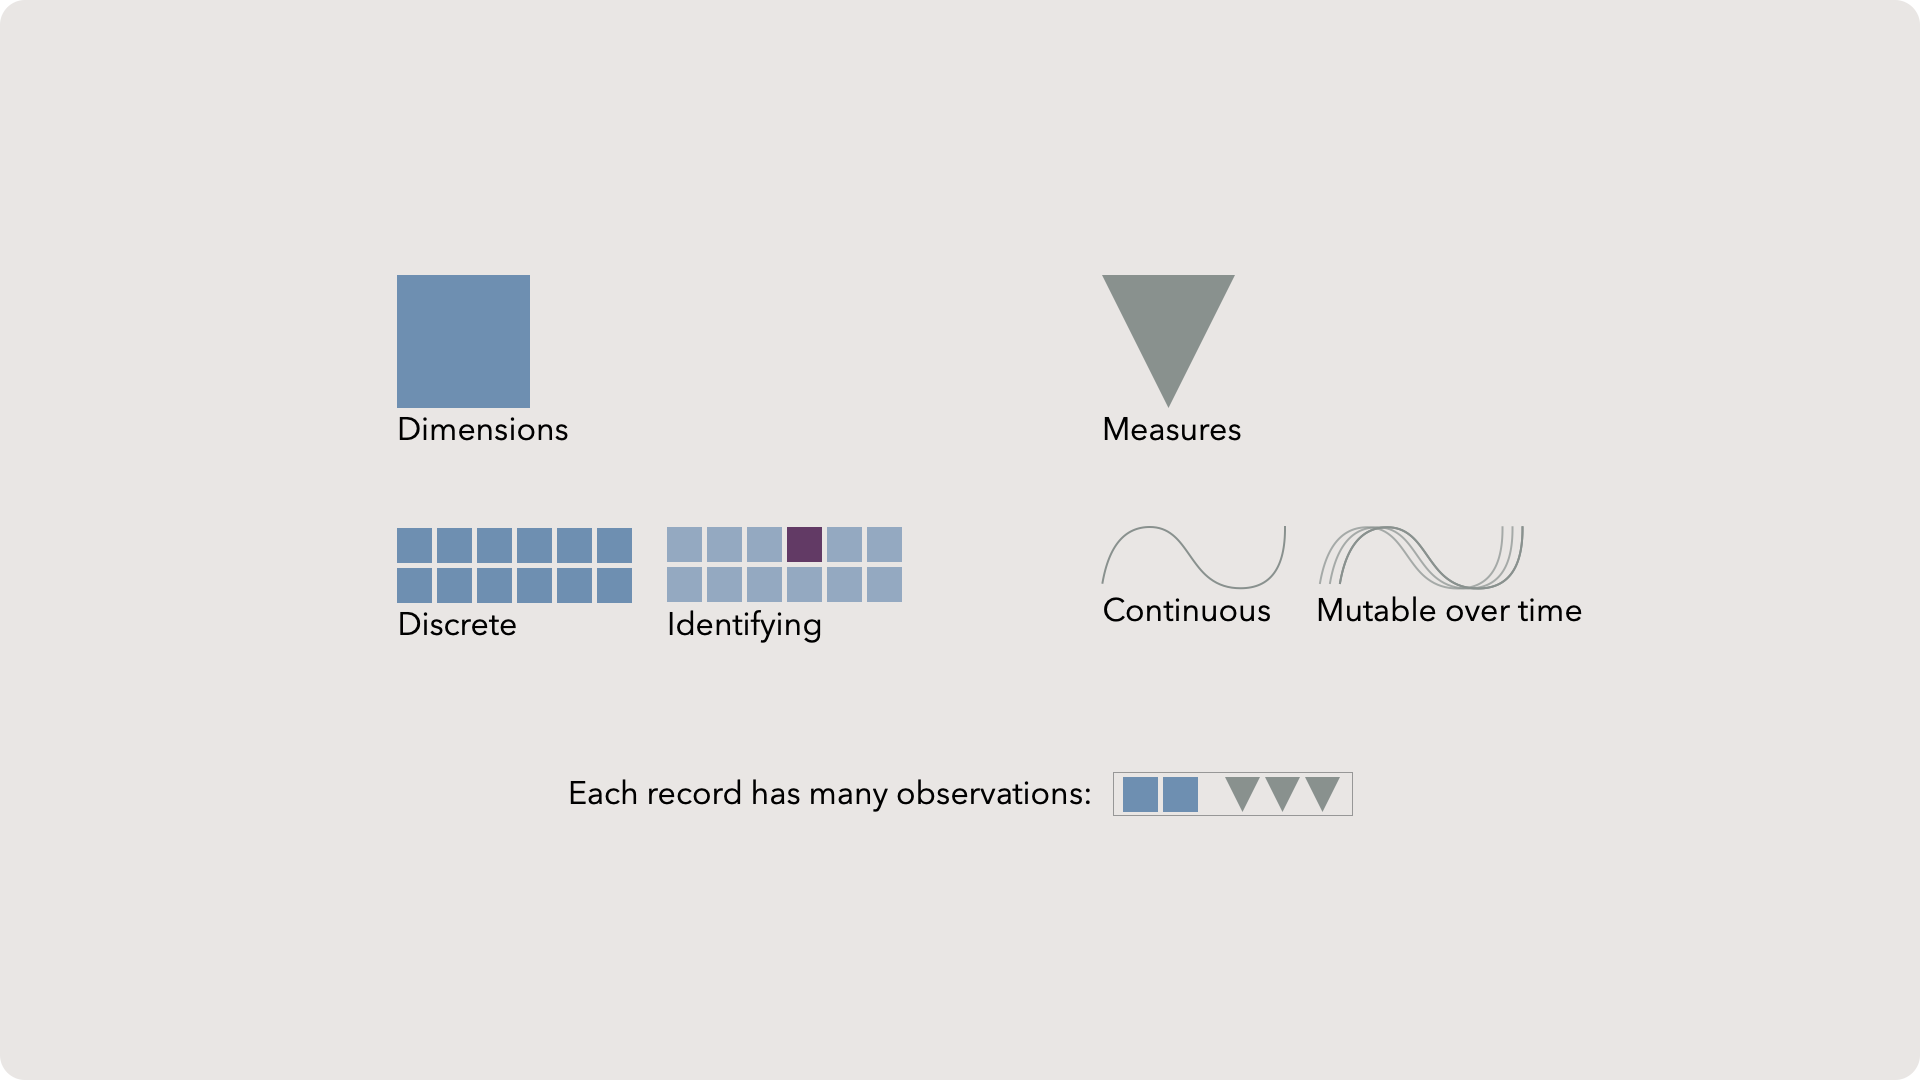
More often than not, your data will come in the form of rows and columns — just like a spreadsheet. Rows are often individual records, or one set of observation like a single person in a group, or an octopus in a reef. Each column represents an attribute or ‘feature’ of that record. An octopus row might have ‘species’, ‘sex’, ‘length’, ‘weight’, or ‘beak size’ as attributes.
Each attribute might have a data type like number, date, or text. When writing code, it is important to understand different data types. But since this is a code-free course, we can simplify to just dimensions and measures.
Measures are a bit more intuitive. Measures are things that are measured. Whoah Elliott! Slow down. Weight, length, and beak size are all things that could change over the course of an octopus' lifetime. Typically, a measure is something that can be aggregated — meaning we could count it up, add or subtract it, or find a center value like the average.
Messy data

Tidy data

Tidy data pt. 2
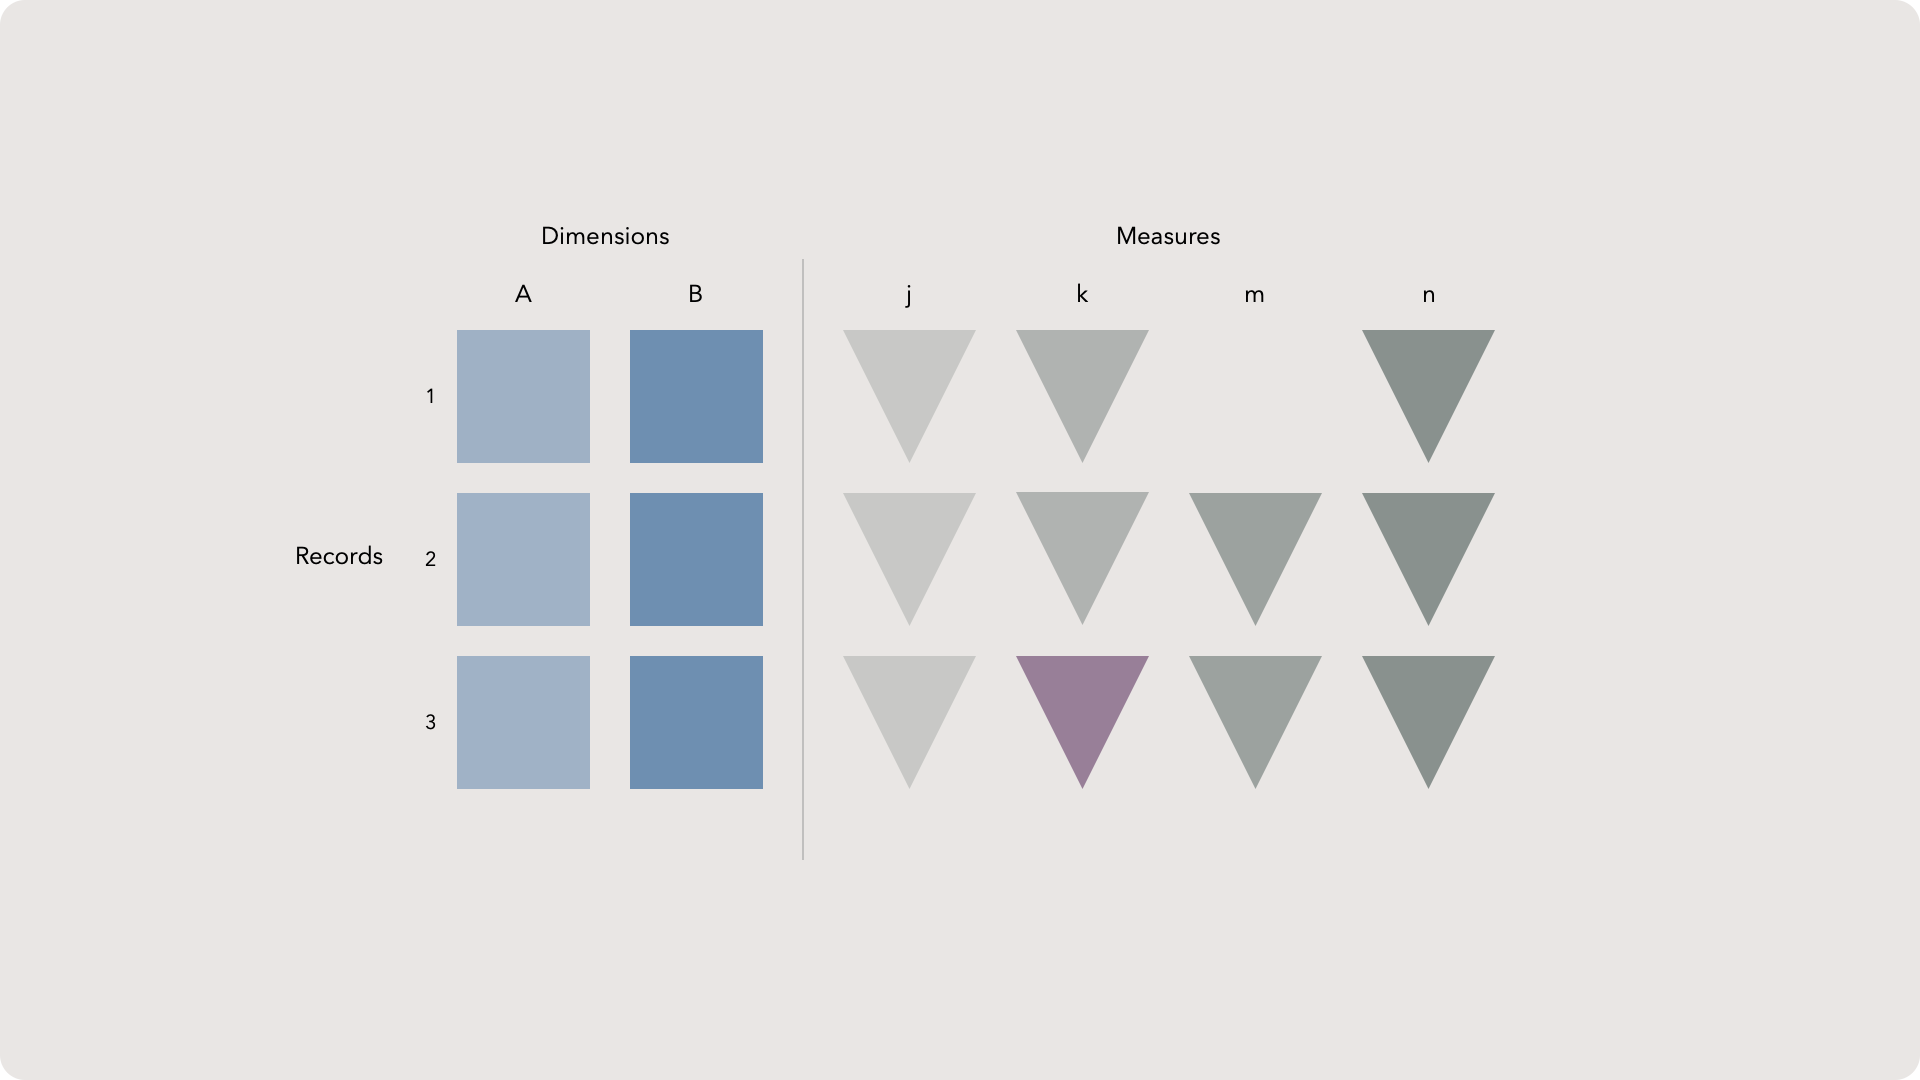
Think for a minute about how we uniquely identify people in society. In the USA we have a social security number, but that is hidden in most cases. Instead, we refer to people by their first and last name, age, and zip code. There might be millions of Elliotts, hundreds of Elliott Whitlings but only one that is also living near Portland, Oregon and in his thirties.
Understanding the data grain is key when prepping your data and tidy data goes hand-in-hand with knowing and sharing your grain.
Encoding data
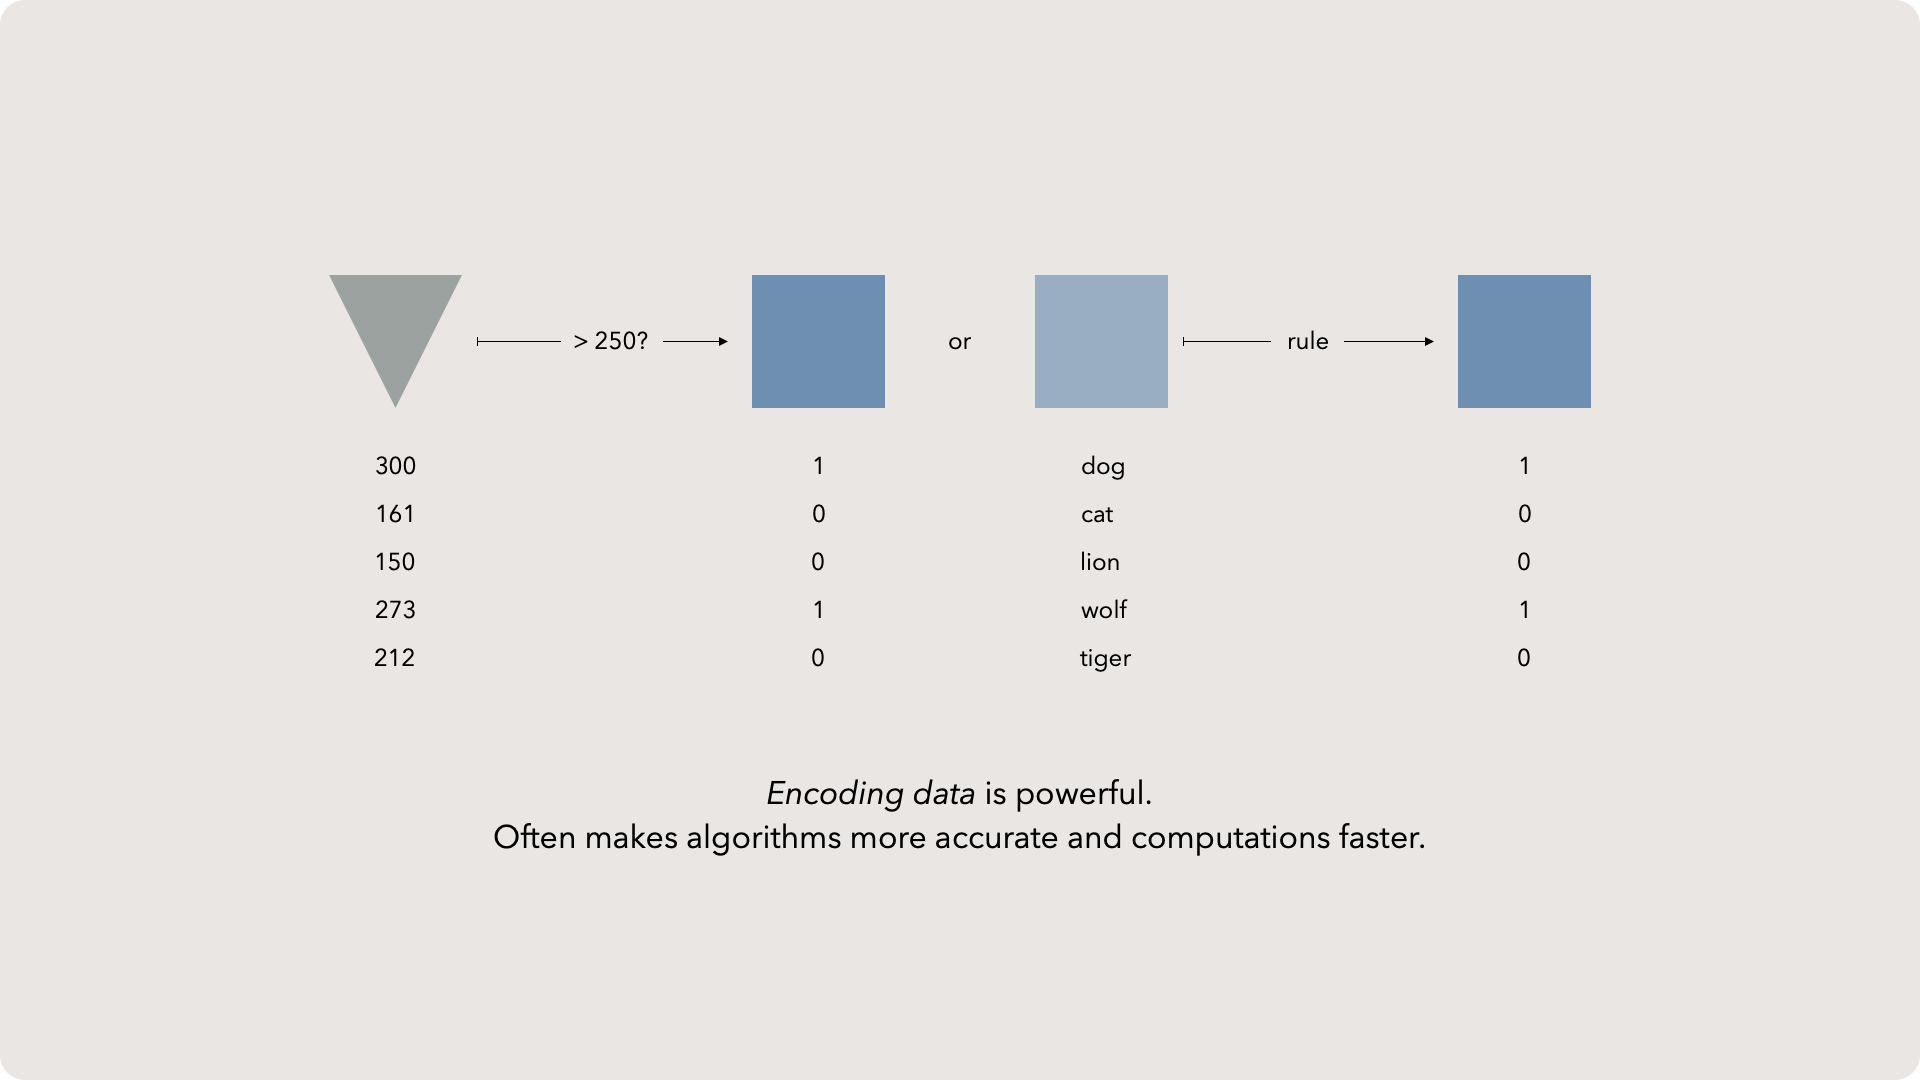
By encoding data, we now have machine intelligible fields to target. Since machine learning and statistics are math-based, feeding text to an algorithm is fruitless. Encoded data lets the machine think natively.
One additional benefit is that zero and ones are wonderfully fast when aggregating data. For example, imagine you want to know how many dogs are in a data set. If you used unencoded data, you would have to count each row that equals 'dog'. With encoded data, you just sum the column which is much faster for most data manipulation tools and languages.
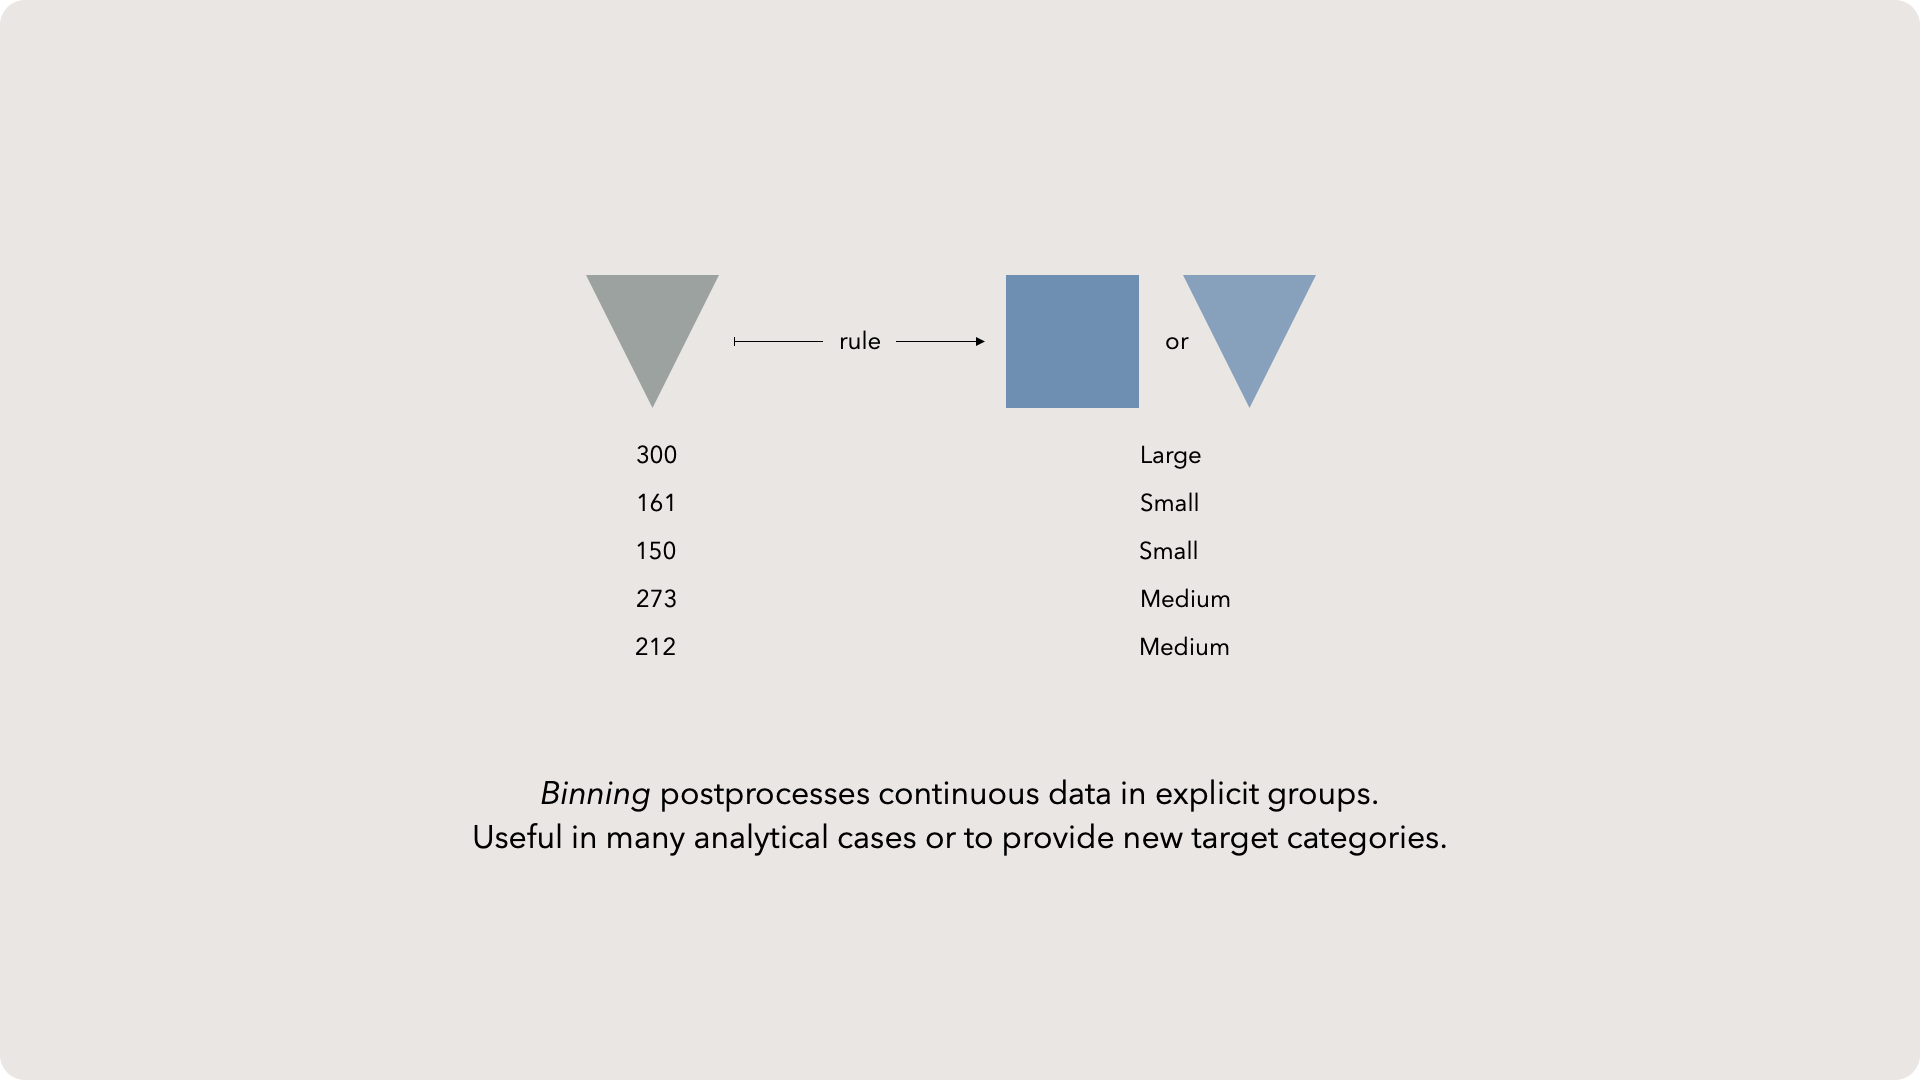
Binning
Imputation
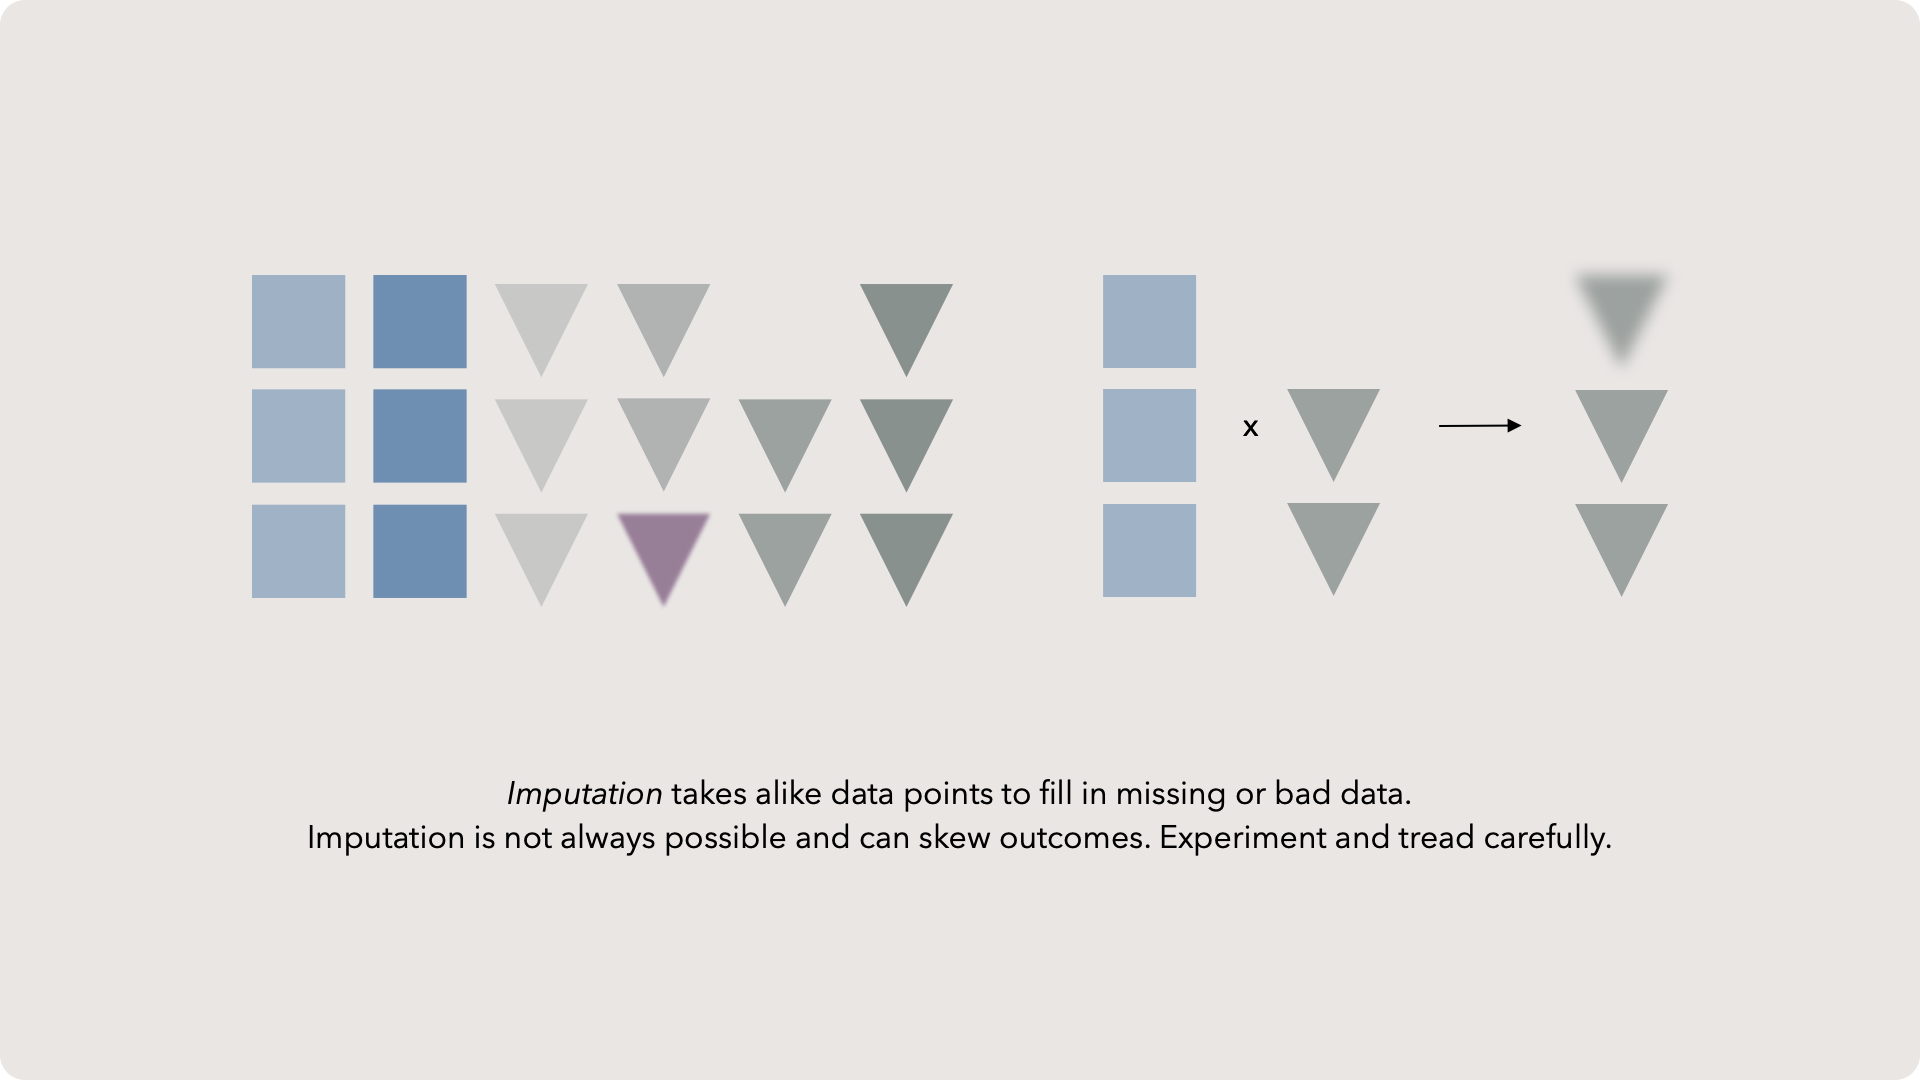
Sometimes in midsized data sets, it is possible to recover those records by using an imputation technique. There are a few approaches but, in general, we find records that are similar in other ways to our bad record. For example, if we are missing the number of goals-per-game an athlete makes, we might grab data from athletes in similar league, position, years of experience, and height (obviously, this is all sport dependent). We could grab the nearby records and weigh their goals-per-game metric in a way that makes the athlete closest to the bad record have the most impact. We then synthesize a new value for our bad data by weighing the goals-per-game against all nearby athletes.
This will only give us a decent guess. Sometimes those guesses are really valuable but occasionally they can skew the data. Imagine if we are comparing a world-class player against grade school equivalents. Our imputation technique would give a wildly wrong answer. Anytime there is not nearby data or the record represents an outlier, we need to be careful.
Normalization
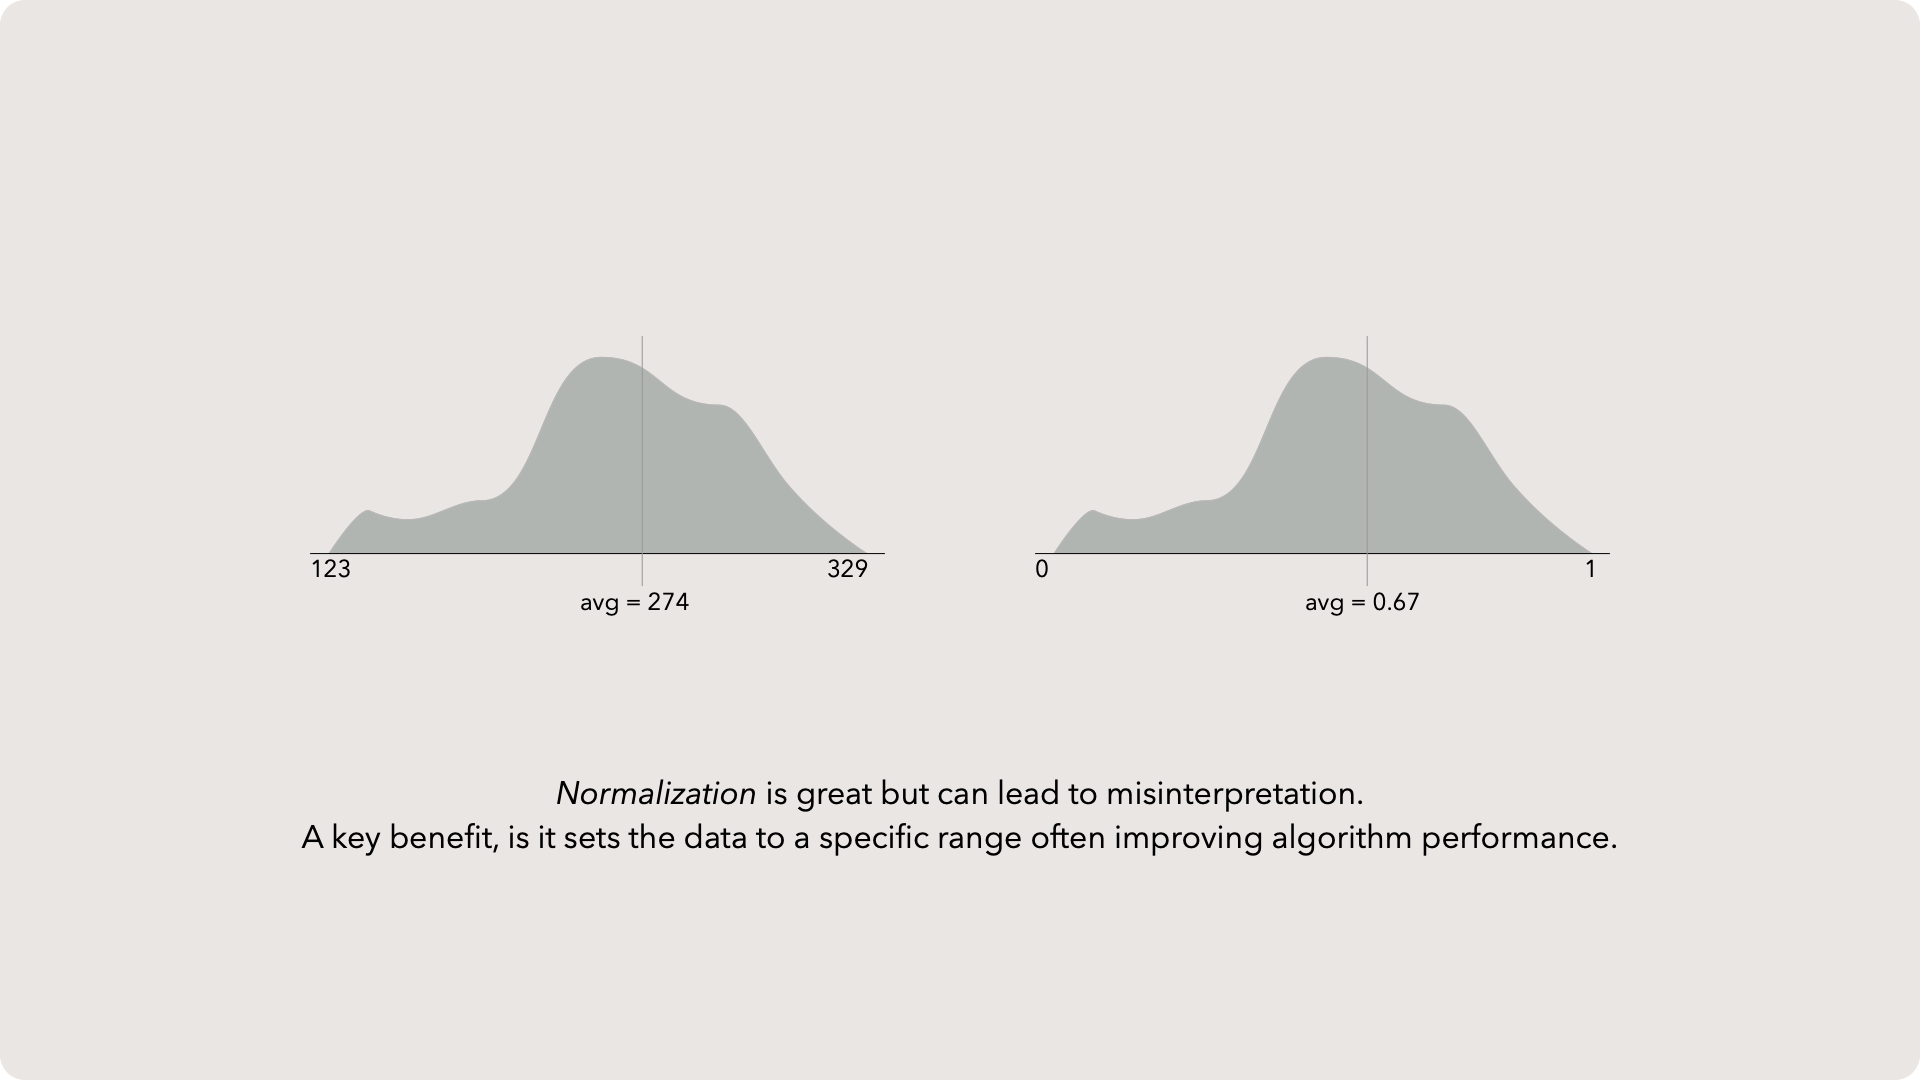
I really like normalizing my data but you do need to be careful as you are changing the units of the data. A normalized fuel mileage value is no longer in miles per gallon and will need to be converted back if you are using that value as a new input. Don't worry-this is an easy process and I find it is commonly worth the tradeoff.
Standardization
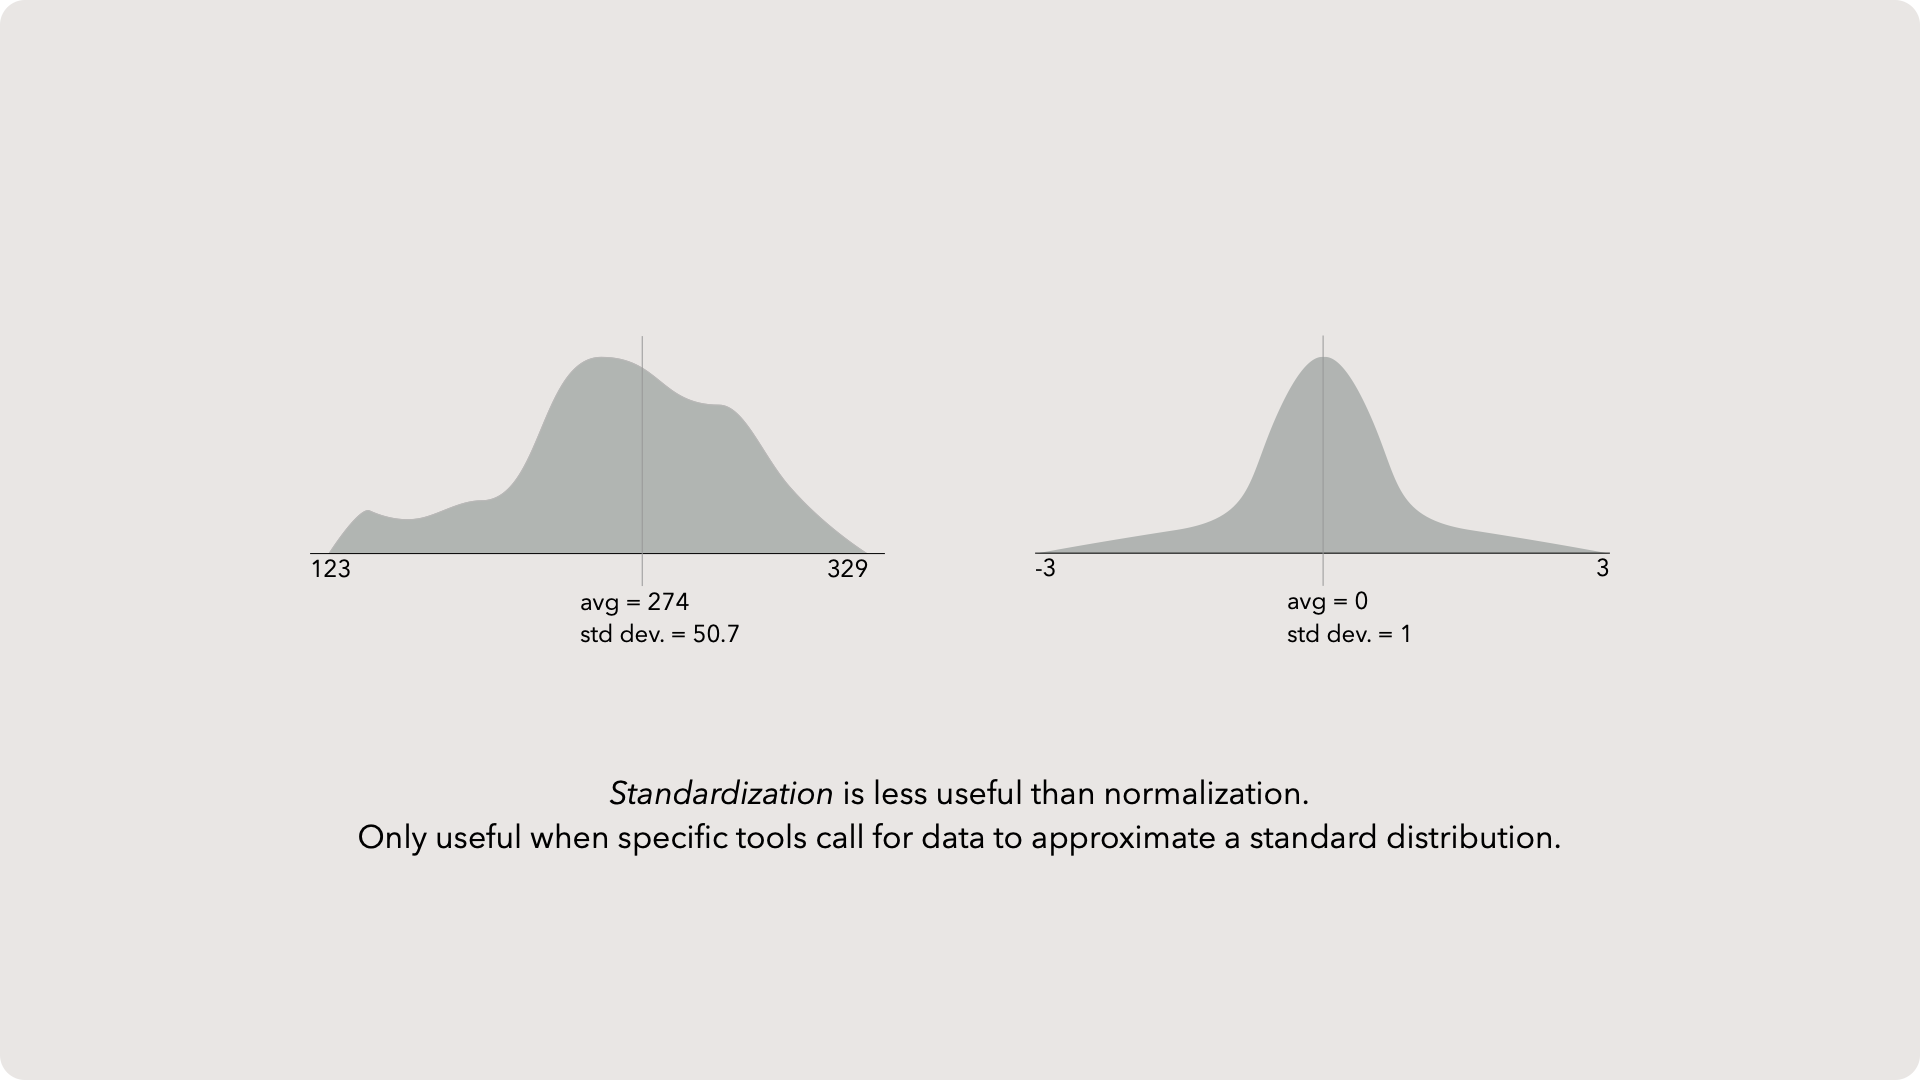
In theory, standardization is a great tool for clustering or other unsupervised learning algorithms (we'll talk about the difference of unsupervised vs supervised later). In practice, I have found standardization to be a rarely utilized tool in my data prep tool belt. Normalization is a much more common transformation in application, although I'm sure other experts have diverging experiences.
Training and testing data

We don't have a perfect formula for how we create these two data sets, but the general best practice is to randomly assign two-thirds of the data to training and the rest to testing. While folks might squabble over the ratios or the assignment technique, the key is make both sets representative. We want the training data to get enough data so the model can learn comprehensively but we don't want the model to simply memorize everything.
Over & Under fitting
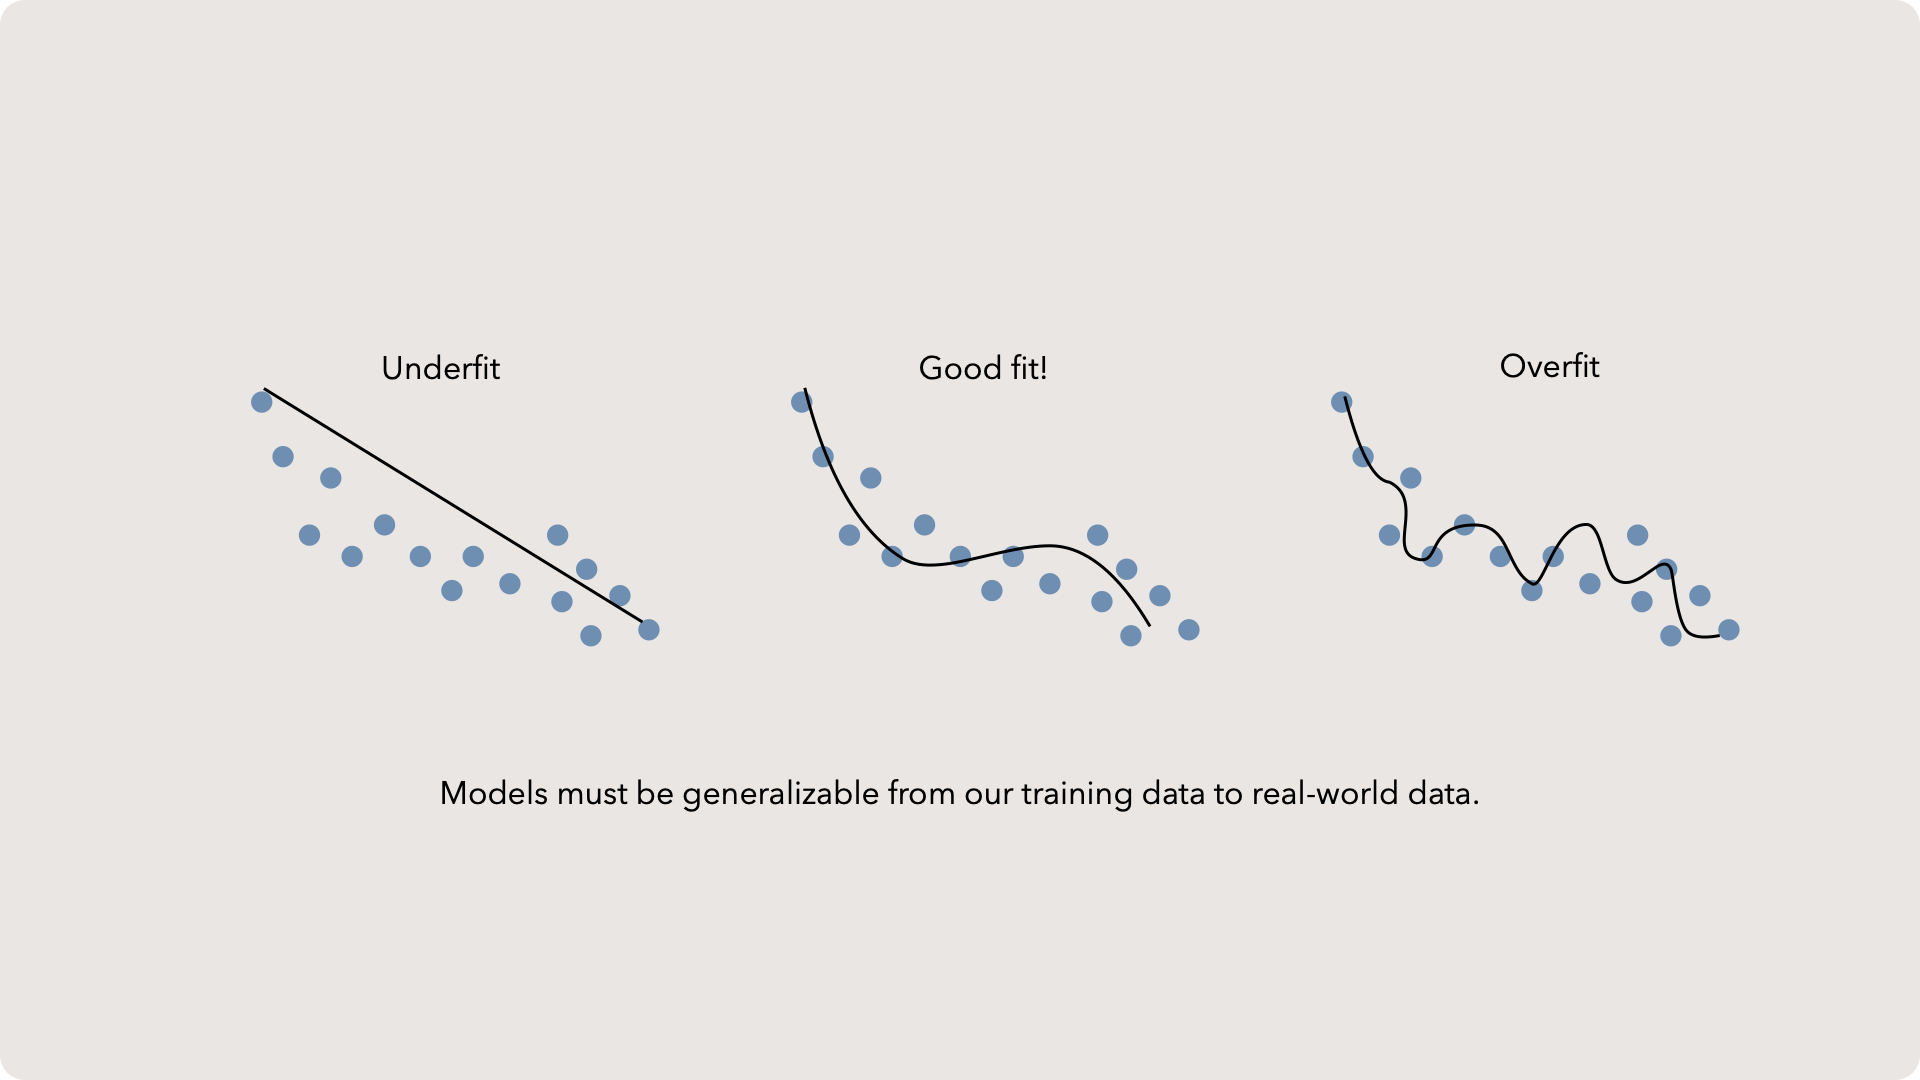
Underfit models are generally a symptom of missing something in the experimental design. Perhaps a key metric was not measured. Meanwhile overfitting is the result of using too many parameters in our model. The data scientist threw every possible measurement at the model. Imagine trying to predict the weather by factoring into your calculation how many pinecones were stepped on by dogs in public parks. That measurement is way too convoluted and specific to help us make a good guess. Remember, models are not reality — only useful approximations!
The goal is to generate a model which lands in a Goldilocks zone — it provides accurate answers when new data is inputed by neither over-simplifying nor convoluting. In many occasions, you can tune your model to a good fit by reducing parameters or adjusting the metrics utilized. Sometimes, it is as easy as changing the model type itself (from linear to quadratic for example).
Connecting back to MLD
